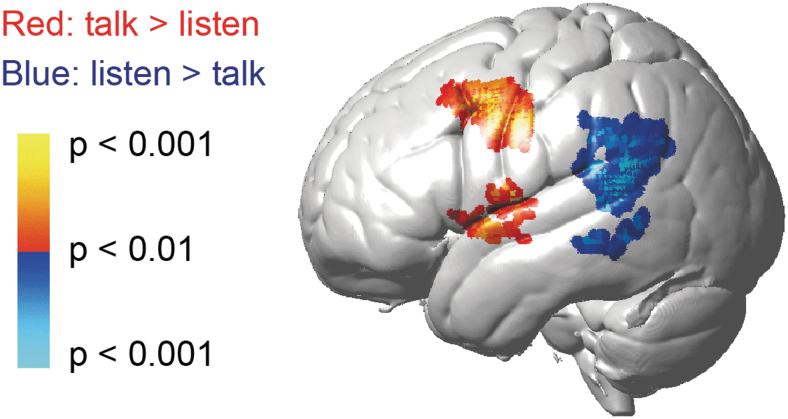
FIG. 4.
GLM contrast map of deOxyHb signals between talking and listening tasks in dialogue condition. Red/yellow indicates regions with larger activity in talking relative to listening, and blue/cyan indicates those with larger activity in listening relative to talking. Please also refer to Table 1 for detailed anatomical locations of the activities. deOxyHb, deoxyhemoglobin; GLM, general linear model.

