FIG. 4.
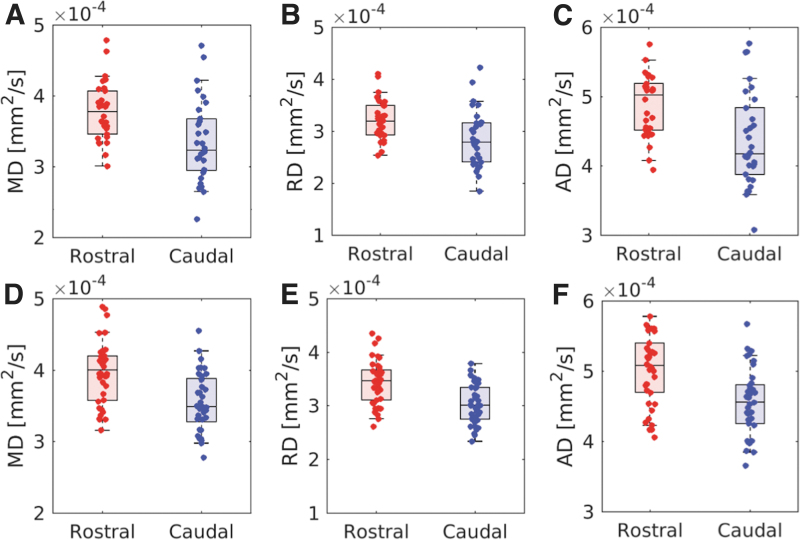
Group comparisons from the LC subregion analysis. Group comparisons for MD, RD, and AD in the rostral and caudal LC subregions from the older adult cohort are shown in (A–C), respectively. Comparisons for MD, RD, and AD in the rostral and caudal LC subregions from the younger adult cohort are shown in (D–F) respectively. Significant decreases in MD, RD, and AD of the caudal LC subregion are seen in both cohorts. Color images are available online.

