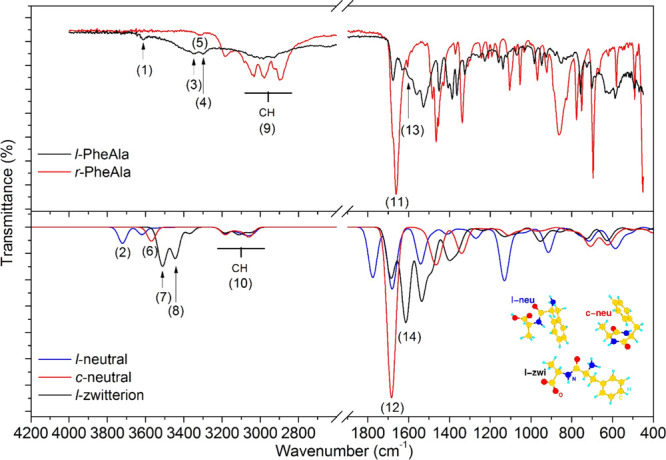
Figure 5.

Top panel: comparison between the IR spectra of l-PheAla (black curve) and r-PheAla (red curve). Bottom panel: comparison between the simulated IR spectra of the l-neutral (blue), c-neutral (red), and l-zwitterion (black) PheAla. The numerical labels refer to some of the main experimental and theoretical characteristic peaks of the different species indicated in Table 2. Inset: optimized structures of l-neutral (l-neu), c-neutral (c-neu), and l-zwitterion (l-zwi) PheAla molecules.
