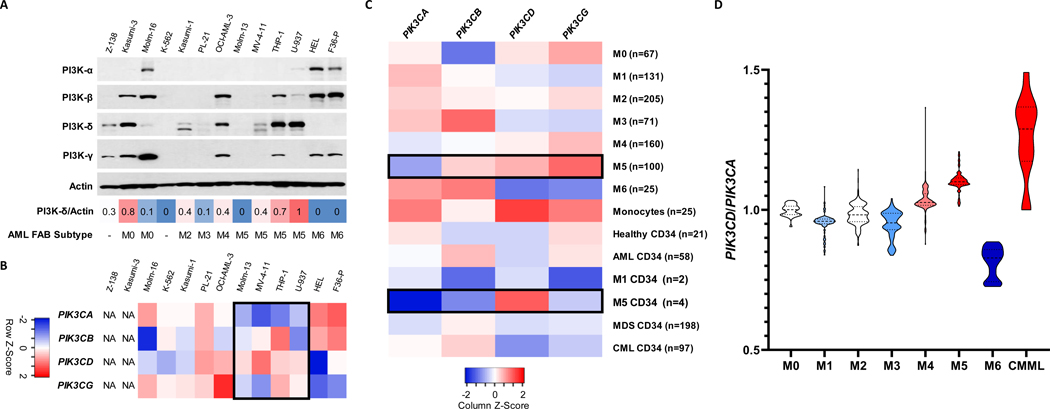
Figure 1. PI3K catalytic subunit expression patterns in myeloid leukemias.
(A) Western blot analysis of 11 myeloid and 1 lymphoid neoplasm cell lines to determine protein levels of PI3K-δ. Actin was used as a loading control. PI3K-δ/Actin ratio describes relative density of western blot band as measured by Image Studio Lite ver 5.2. French-American-British (FAB) subtyping differentiates AML by cell maturity and origin based on histological evaluation. (B) Heatmap of the microarray median gene expression of PI3K catalytic subunit genes in available cell lines in the CCLE. NA = not available (C) Heatmap of the median gene expression for each AML FAB class, healthy samples, healthy monocytes, and CD34+ cells from AML, MDS, CML and healthy donor samples in the Hemap dataset. (D) Violin plot of PIK3CD to PIK3CA median log2 gene expression ratio by AML FAB subtype from Hemap data set. CMML data gathered from Gelsi-Boyer et al.21

