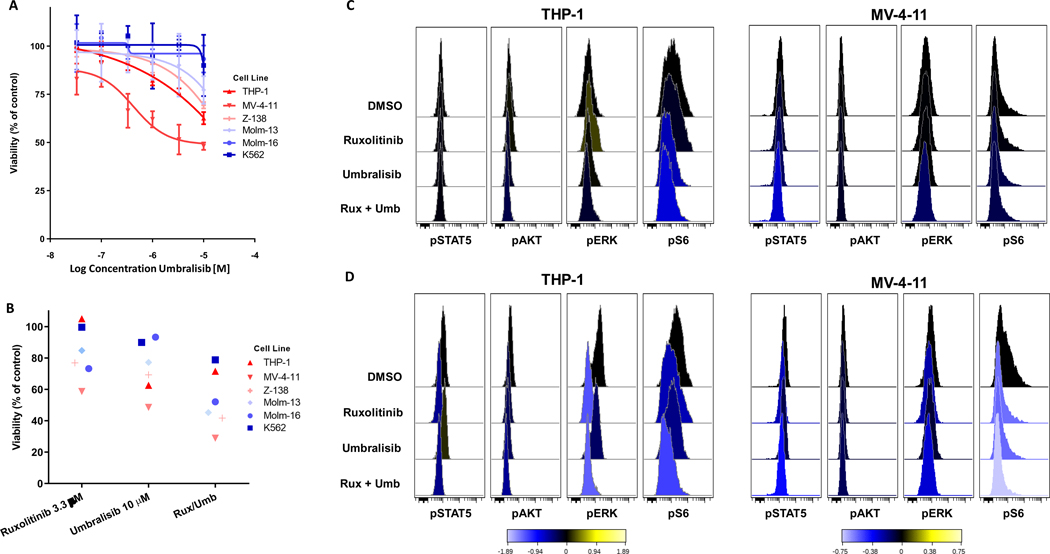
Figure 2. Ruxolitinib/umbralisib combination treatment of leukemia cell lines.
(A-B) The viability of treated cell lines compared with DMSO control using the CellTiter-Glo assay was plotted for (A) the indicated concentration gradient of solo agent umbralisib and (B) at selected concentrations of both ruxolitinib, umbralisib and the combination. Each symbol represents the mean of three experimental replicates. The color associated with each cell line relates to the relative expression of PI3K-δ as determined by western blot analysis. (C-D) Histograms from a representative experimental replicate (n = 2) of phospho-specific flow cytometry analysis of cell signaling responses of THP-1 and MV-4–11 cell lines to the combination treatment in the absence (C) or presence (D) of GM-CSF stimulation. Values represent arcsinh of the median fold change from DMSO treated cells.

