
Figure 2.
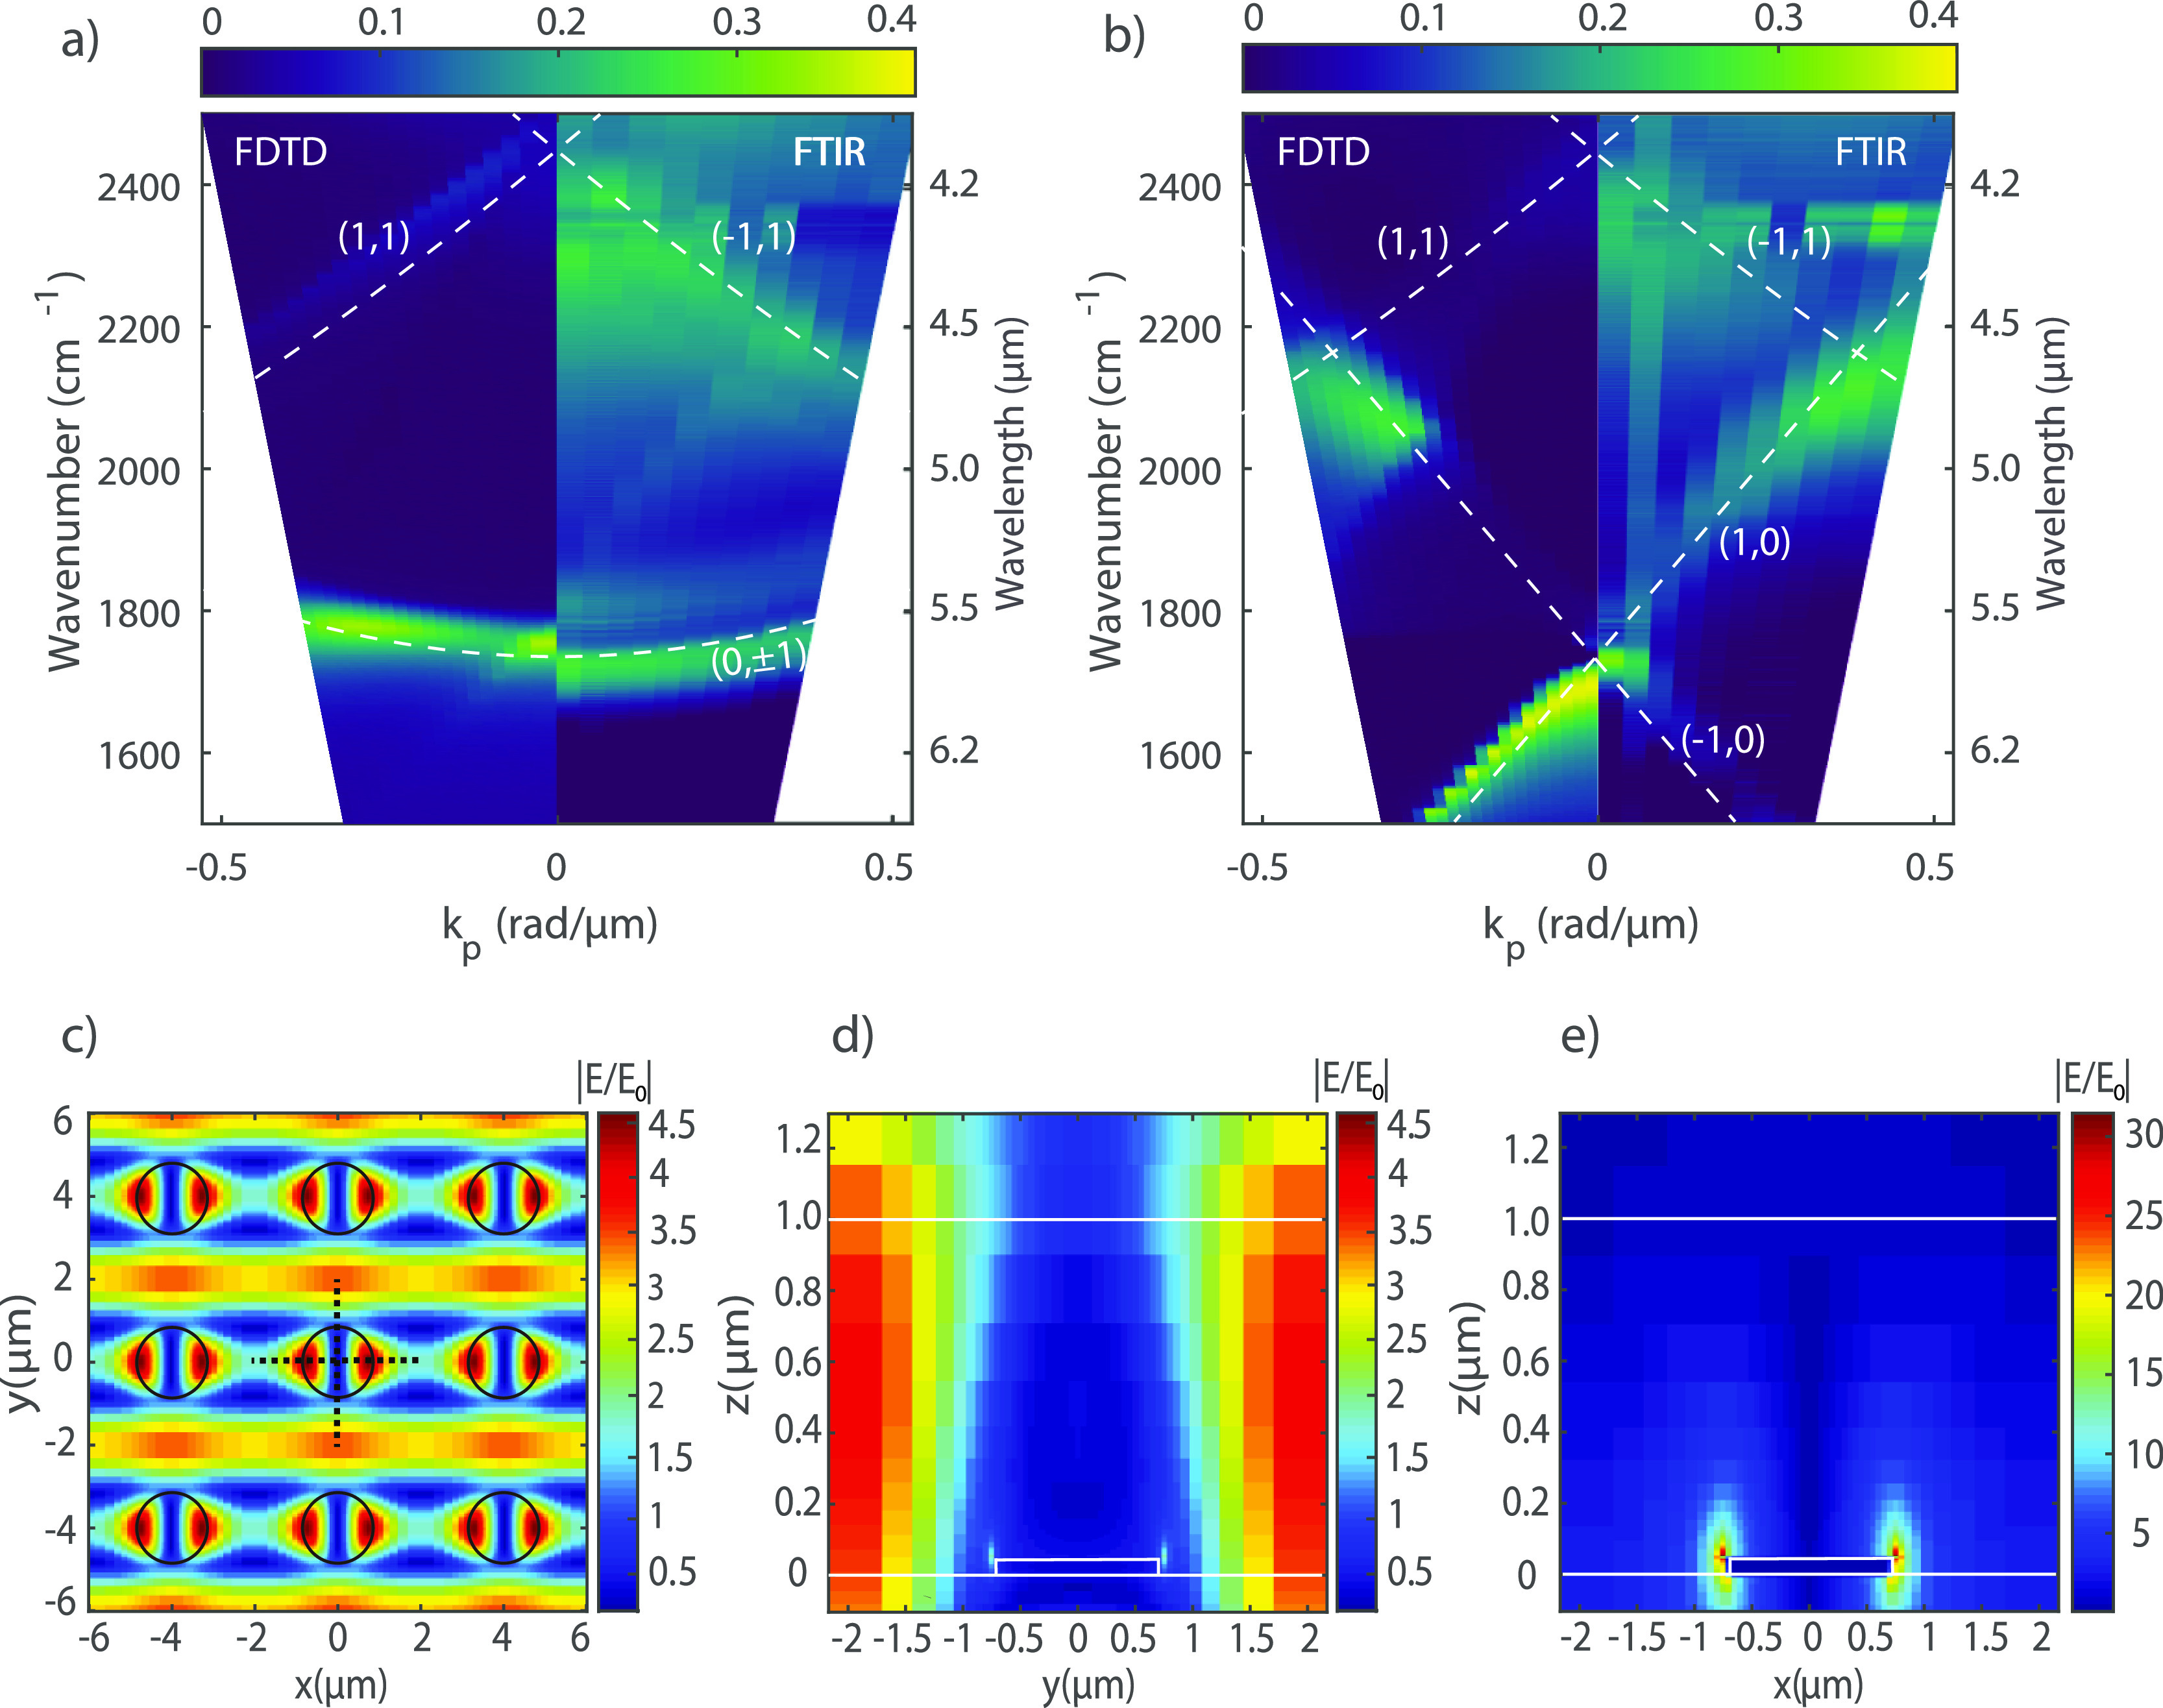
FDTD simulations and IR extinction measured with an FTIR spectrometer by varying the angle of incidence from normal up to 20° for (a) p-polarized light and (b) s-polarized light. (c) FDTD simulations of the amplitude enhancement of the scattered electric field E/E0 at the height of 400 nm above the substrate and wavenumber of 1732 cm–1 (x–y cross-section). The black dotted lines on the central particle show the position where the y–z cross-section and the x–z cross-section are investigated. Amplitude enhancement of the scattered electric field in (d) the y–z and (e) x–z planes at 1732 cm–1.