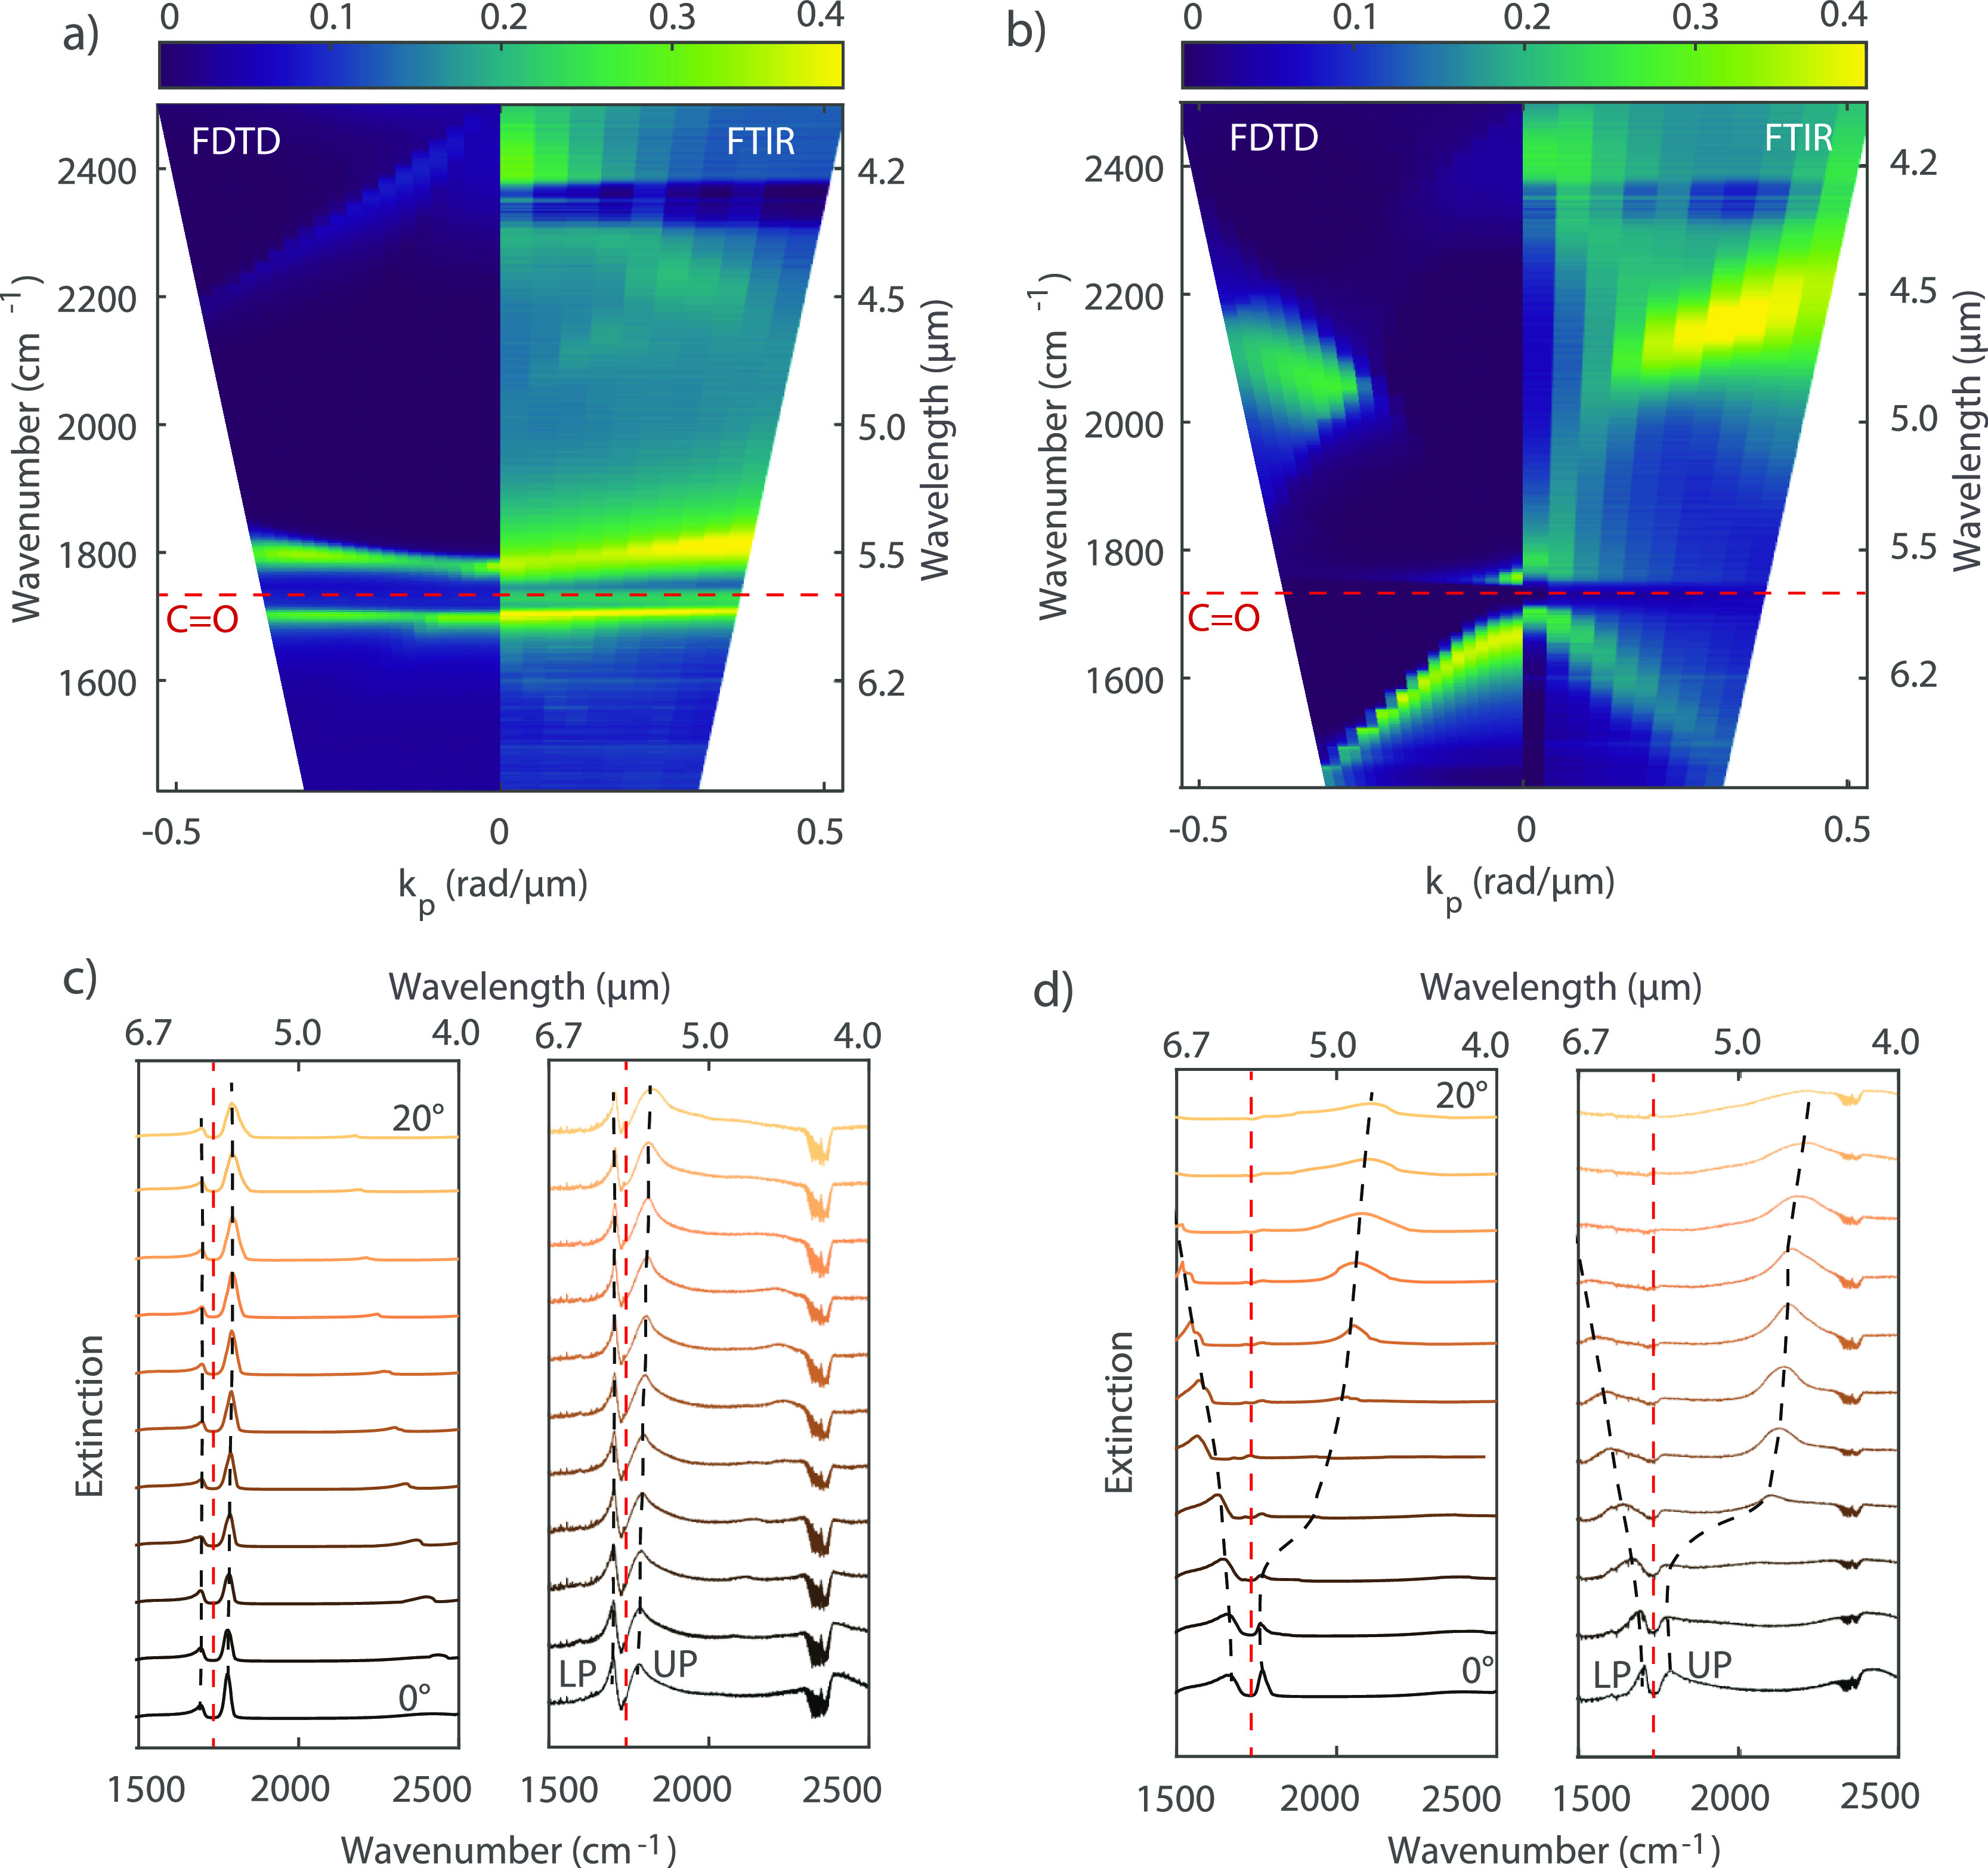
Figure 3.

Extinction spectra of a strongly coupled array simulated and measured at different angles of incidence. The simulations are multiplied by 0.4 to facilitate the comparison. (a) Comparison between simulated and measured extinction for p-polarized light. (b) Comparison between simulated and measured extinction for s-polarized light. Polaritons are clearly visible for both polarizations around the C=O bond wavenumber (1732 cm–1) indicated by the red dashed line. (c) Simulated (left) and measured (right) spectra for different angles of incidence and p-polarized light. These spectra have been displaced vertically for clarity. The red dotted curve represents the spectral position of the C=O vibration. The black dotted lines are a guide to the eyes for the lower and upper polaritons. The feature in all spectra around 2400 cm–1 is the CO2 signature peak in the mIR. (d) Simulated (left) and measured (right) spectra for different angles of incidence and s-polarized light.
