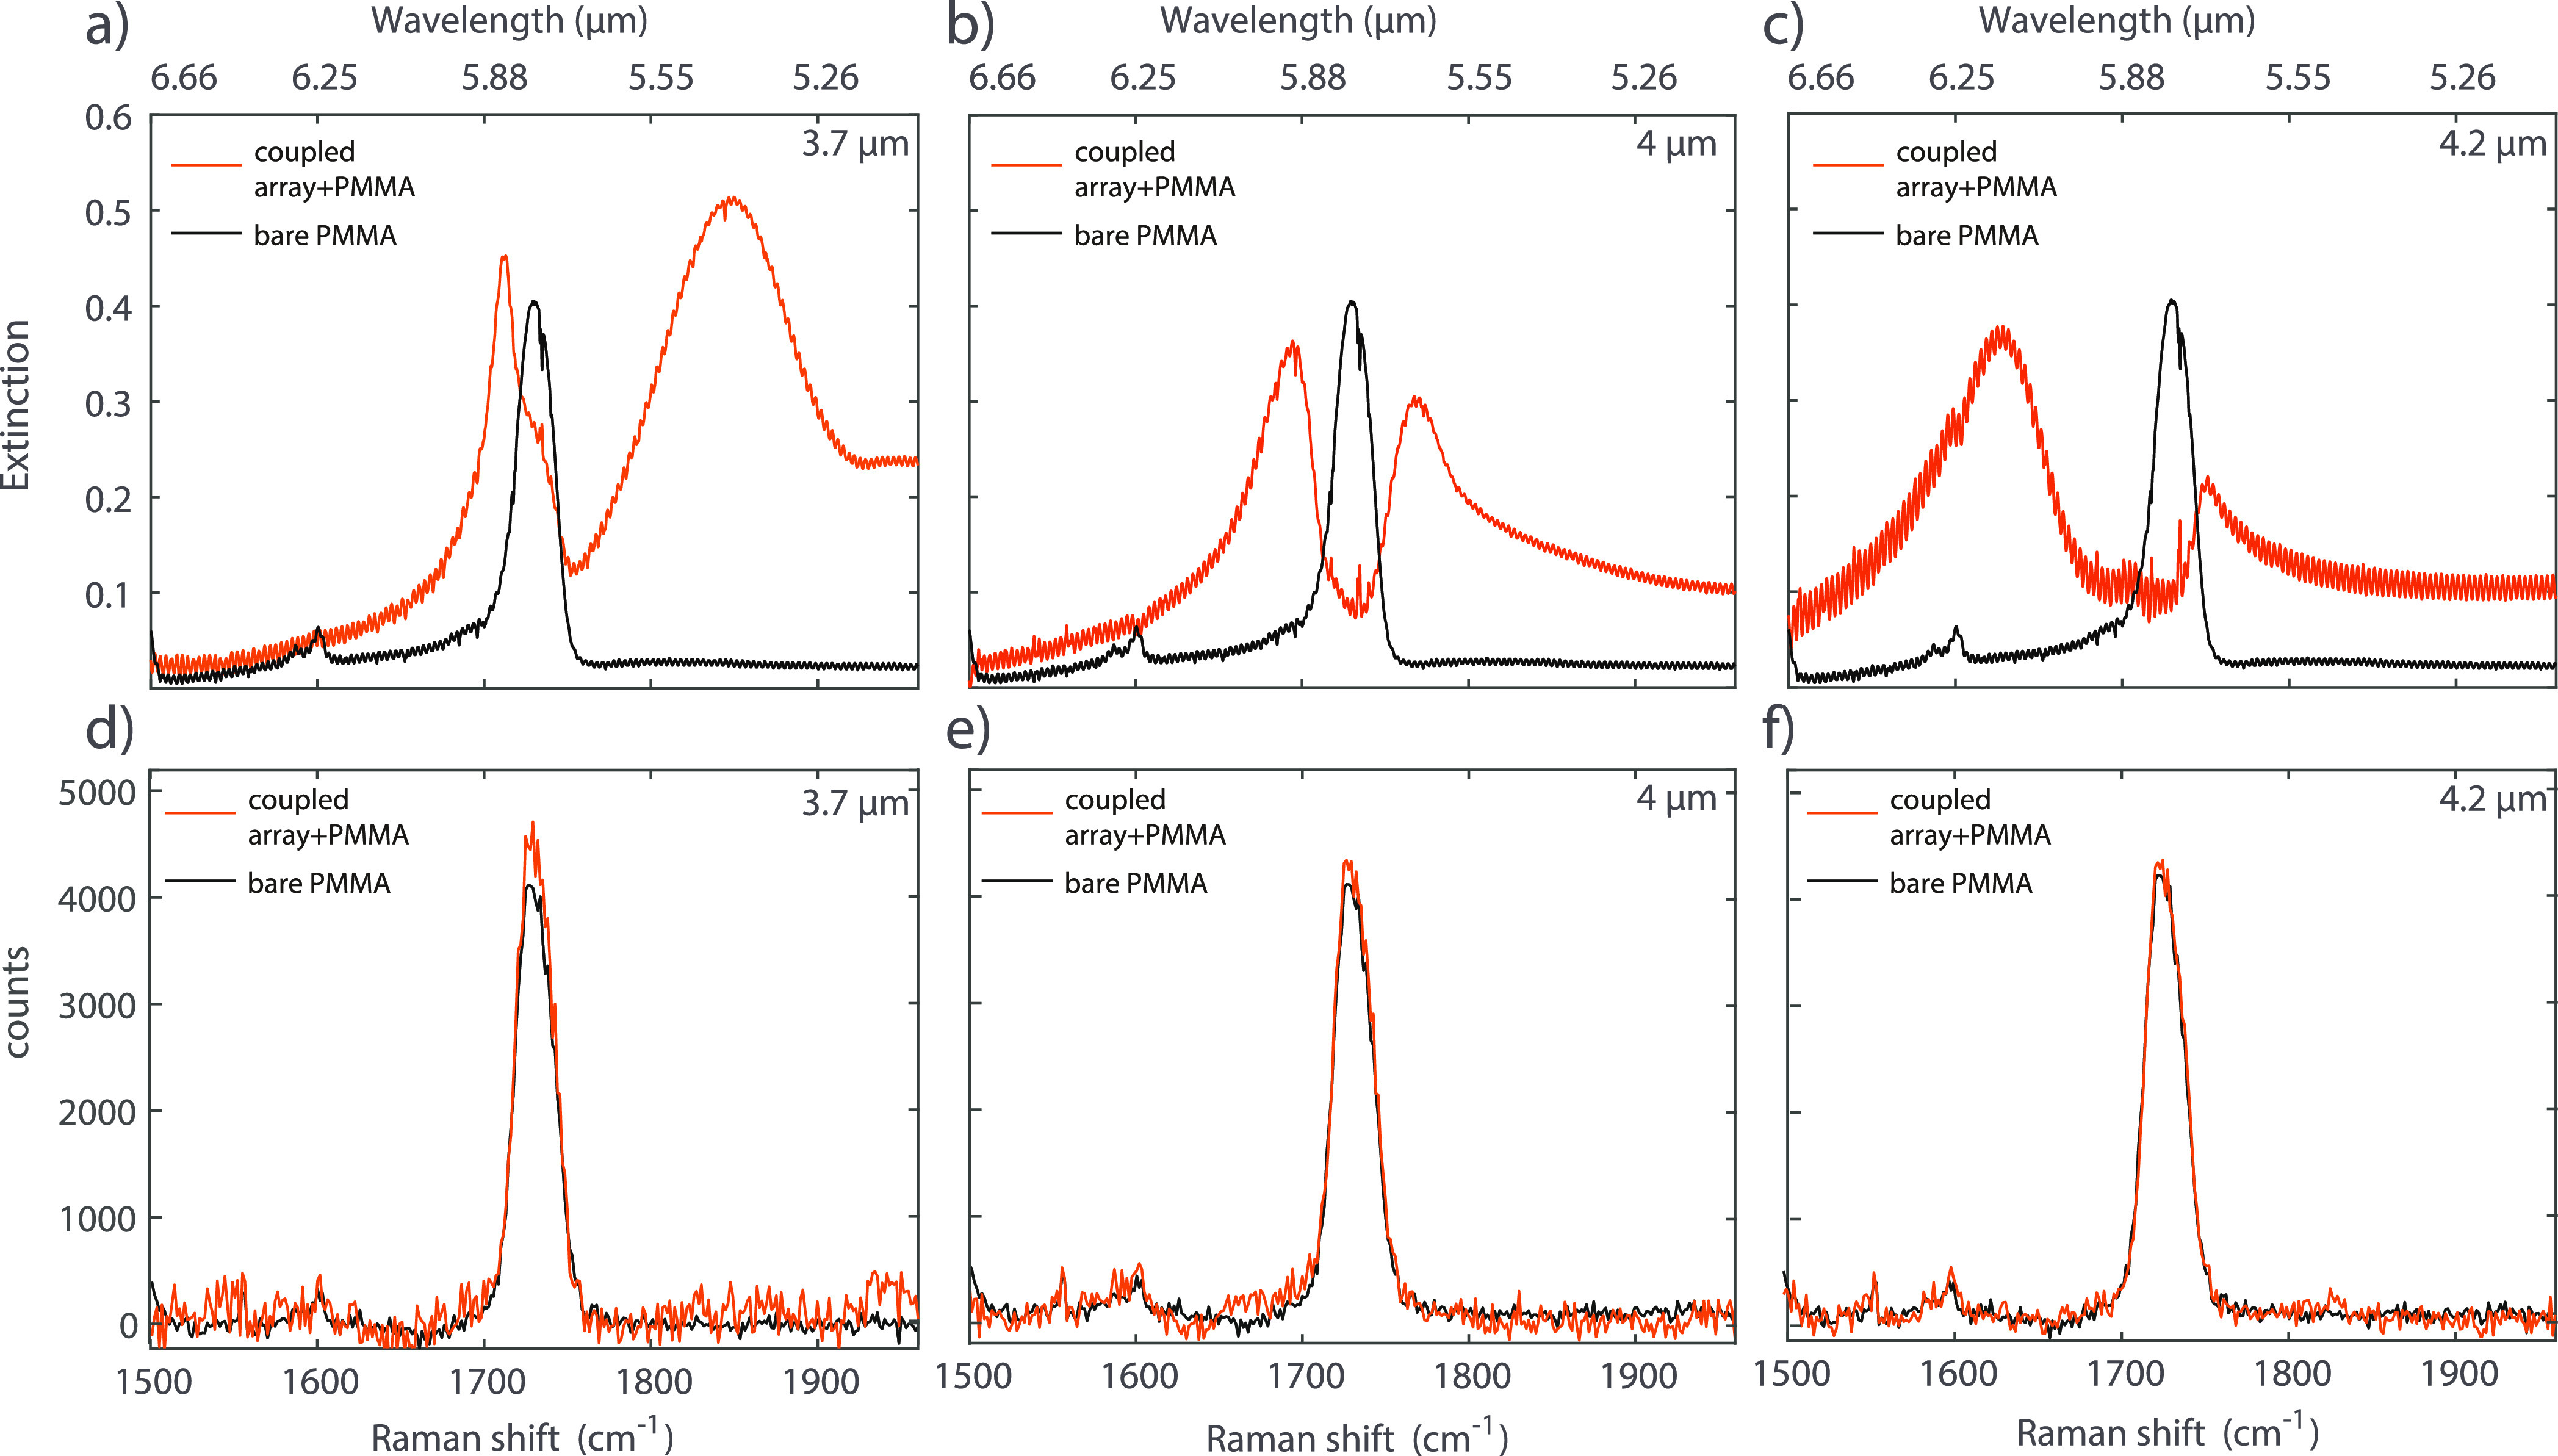
Figure 5.

FTIR and Raman spectra of the bare PMMA layer and the coupled systems with different SLR-C=O detunings. FTIR (a) and Raman (d) spectra for the array with a period of 3.7 μm; the black spectra are reference measurements on the bare PMMA layer, while the orange spectra are the measurements on the coupled array with PMMA. FTIR (b) and Raman (e) spectra for the array with a period of 4 μm. FTIR (c) and Raman (f) spectra for the array with a period of 4.2 μm.
