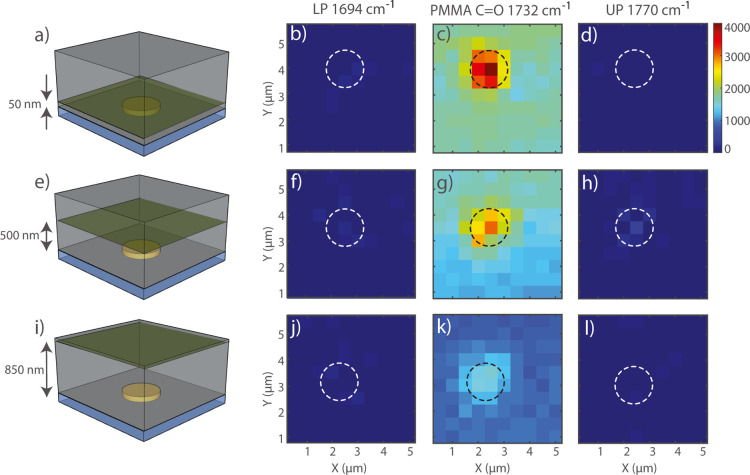
Figure 6.
Intensity maps of the Raman signal at the wavenumber 1694 cm–1 (LP), 1732 cm–1 (PMMA C=O), and 1770 cm–1 (UP) in the unit cell of the array. The measurements are performed on the array with a 4 μm period. The imaging is performed at heights of 50 nm (a), 500 nm (e), and 850 nm (i). (b) Shows the maps measured at the energy of the lower polariton and a height of 50 nm. (c) Shows the maps measured at the energy of the PMMA carbonyl peak and a height of 50 nm. (d) Shows the maps measured at the energy of the upper polariton and a height of 50 nm. (f–h) show the upper, the C=O bond, and the lower polariton (respectively) energy maps measured at 500 nm. (j–l) show the upper, the C=O bond, and the lower polariton (respectively) energy maps measured at 850 nm.

