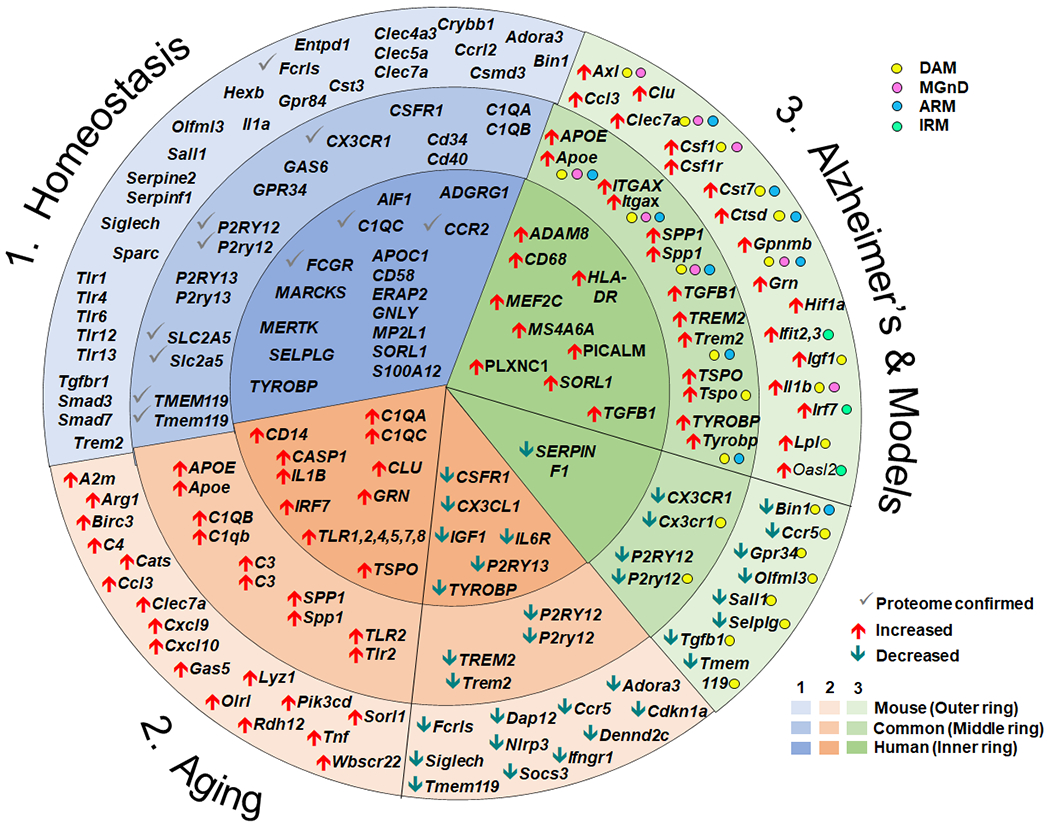
Figure 1.

Summary of select gene expression changes in health, aging and Alzheimer’s disease. The circle represents gene expression. Data from mice are presented in the outer ring (light shading), while data from human are presented in the interior circle (darkest shading). Gene changes that are expressed by both human and mouse are presented in the middle ring with medium shading. Genes associated with homeostatic microglia are presented within the blue wedge (1) with the gene expression changes confirmed at the proteomic level indicated with a grey check mark. Changes in gene expression accompanying aging are presented in the beige wedge (2). Genes that are increased with aging relative to young adult are indicated with red up arrows, while genes that decrease are indicated with green down arrows. Changes in gene expression accompanying Alzheimer’s disease or Alzheimer-like pathology in mouse models are presented in the green wedge (3). In humans, increases and decreases compared with participants with no cognitive impairment are displayed in the green inner ring with red up or green down arrows, respectively. Within the wedge and ring for mouse models with Alzheimer-like pathology, the genes associated with the activated microglial subtypes DAM65, MGnD66, ARM42 or IRM42 are identified with color dots and the increase or decrease expression relative to the homeostatic profile indicated with red or green arrows. Not all gene changes can be depicted in the diagram.
