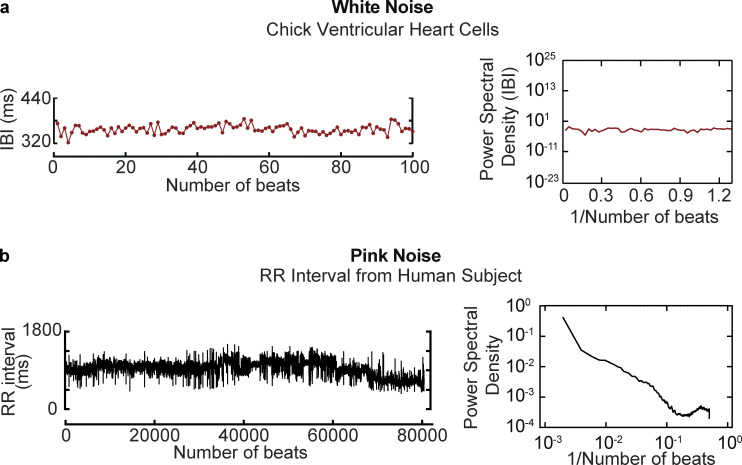
Figure 1.
Time and frequency profiles of Gaussian and pink noise. (a) Example of white noise. Data in this panel were reproduced from Krogh-Madsen et al. (2017) and show the time course of interburst intervals (left column) recorded from a chick ventricular cardiomyocyte and corresponding power spectral density (right column). (b) Example of pink noise. Time course of RR interval from a 53-yr-old man (left column) obtained from Irurzun et al. (2021). The power spectral distribution of this trace is shown in the right column.

