Figure 3.
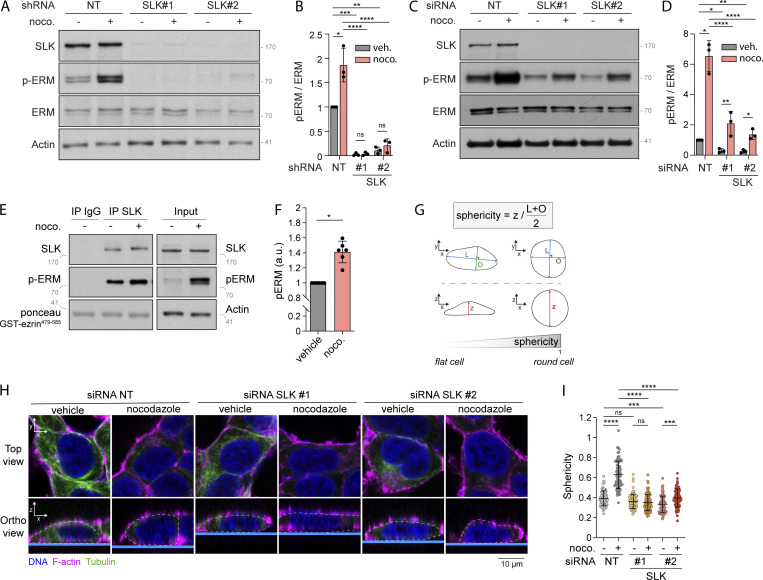
Nocodazole-induced microtubule disassembly promotes interphase cell rounding depending on SLK activation. (A–D) Immunoblots of HEK293T cells stably expressing non-target shRNA (NT) or two independent shRNA targeting SLK (A) or HEK293T cells transiently transfected with non-target siRNA (NT) or two independent siRNA targeting SLK (C) and incubated with vehicle (DMSO) or 1 µM nocodazole (noco.) for 15 min. p-ERM over ERM (B) or actin (D) signals were quantified and normalized to NT incubated with vehicle (B and D). (E and F) Kinase assay of endogenous SLK immunoprecipitated from HEK293T cells incubated with vehicle (DMSO) or 1 µM nocodazole for 15 min. Total lysate (input) is shown in the right panels (E). p-ERM signals were quantified and normalized to vehicle (F). (G–I) Measurement of cell sphericity in HEK293T cells incubated with the indicated treatments. (I) Cell sphericity was quantified as a ratio between cell height (z) and cell shape within the x/y plane, which is determined as the average length of the longer axis (L) and its orthogonal (O); see G and Material and methods section for more details. (H) F-actin, red; tubulin, green; DNA, blue. Dashed white lanes underline cell periphery in the orthogonal view. Top panels show confocal planes (Top view), and lower panels show orthogonal views (Ortho view; n > 80 cells). p-ERM and sphericity quantifications represent the mean ± SD of at least three independent experiments. Dots represent independent experiments (B, D, and F) or individual cells (I). P values were calculated using one-sample t test (F) or using Holm-Sidak’s multiple comparisons test with a single pooled variance (B, D, and I) except for comparison made with normalizing condition (NT + vehicle [B and D]) where one-sample t test was applied. *, P < 0.05; **, P < 0.01; ***, P < 0.001; ****, P < 0.0001. Numbers associated with Western blots indicate molecular weight in kD. Source data are available for this figure: SourceData F3.

