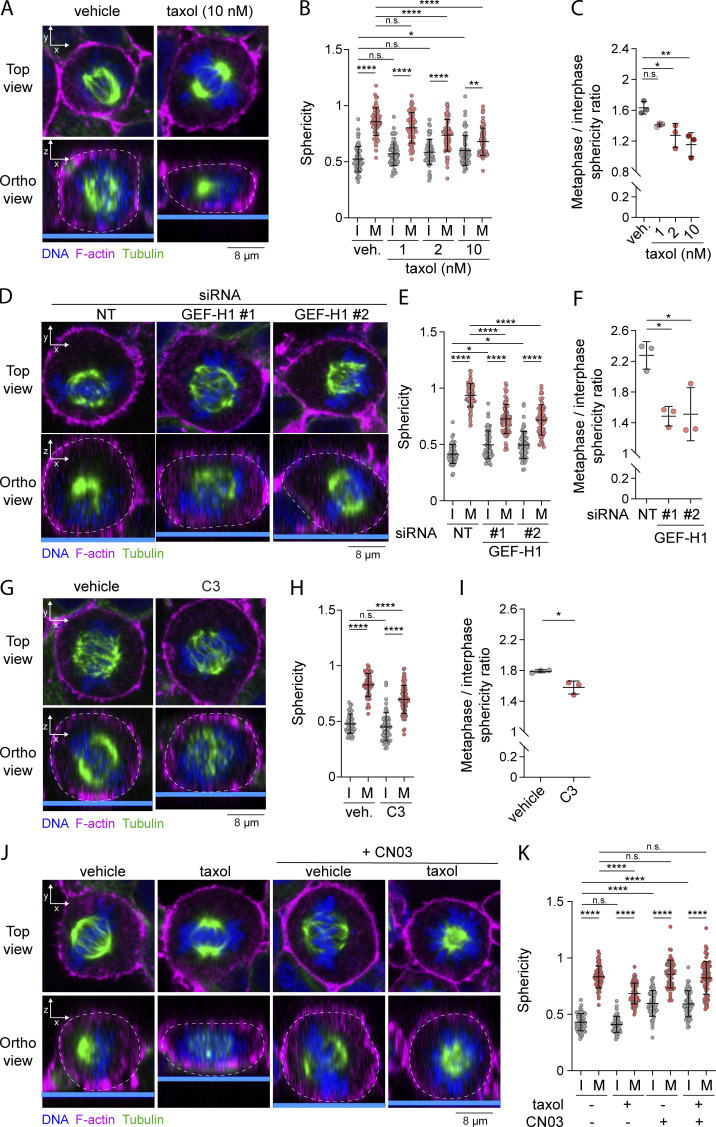
Figure 6.
Interphase microtubules disassembly at mitotic entry controls cell rounding in metaphase. (A–K) Sphericity and mitotic rounding defects were measured using immunofluorescence 3D reconstitution after confocal microscopy in HEK293T cells incubated with vehicle (DMSO) or indicated concentrations of taxol for 90 min (A–C; n > 60 cells), transiently transfected with non-target siRNA (NT) or two independent siRNA targeting GEF-H1 (D–F; n > 50 cells), incubated with vehicle (veh.; water) or 1 µg/ml C3 transferase for 6 h (G–I; n > 50 cells), or incubated with vehicle (DMSO), 10 nM taxol for 90 min and/or 1 µg/ml Rho activator II (CN03) for 1 h (J and K; n > 50 cells). Sphericity was measured as in Fig. 3 G (B, E, H, and K). Mitotic rounding defects were assessed by measuring the mean sphericity ratio of metaphase to interphase cell populations (C, F, and I). (A, D, G, and J) Top panels show confocal planes (Top view), and lower panels show orthogonal views (Ortho view). I, interphase; M, metaphase. Immunofluorescences (A, D, G, and J) are representative of three independent experiments. Quantifications of sphericity and sphericity ratio of metaphase-to-interphase populations represent the mean ± SD of three independent experiments. Dots represent individual cells (B, E, H, and K) or independent experiments (C, F, and I). P values were calculated using Holm-Sidak’s multiple comparisons test with a single pooled variance (B, E, H, and K) or using a two-tailed paired t test (C, F, and I). *, P < 0.05; **, P < 0.01; ****, P < 0.0001.

