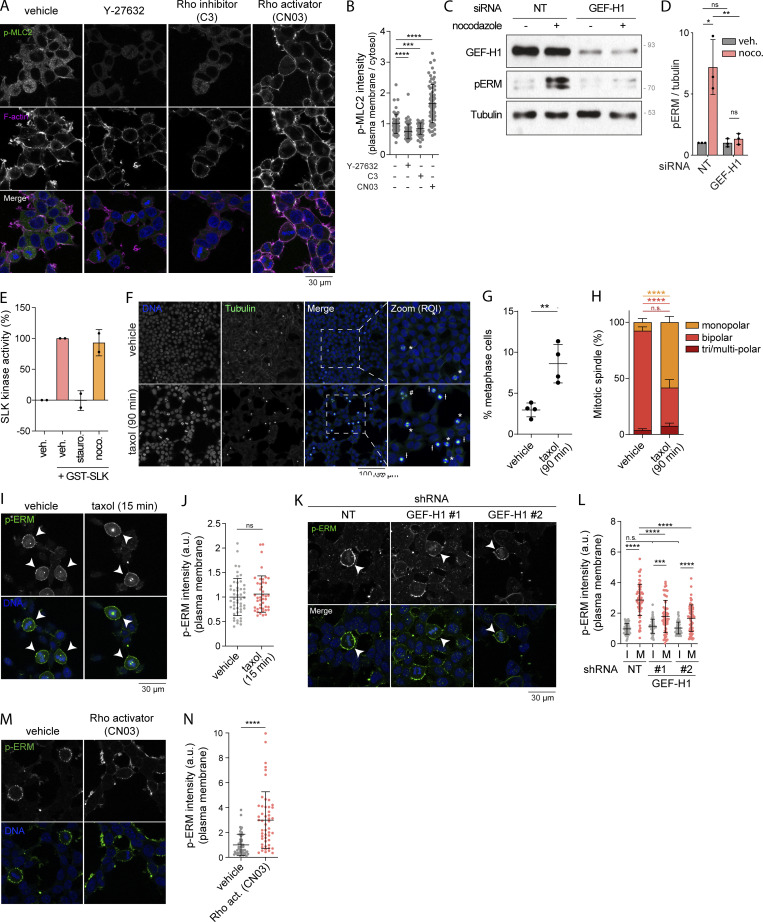
Figure S2.
Taxol-induced microtubule stabilization affects mitotic spindle organization while GEF-H1 and RhoA are key regulators of ERM during mitosis. (A and B) Immunofluorescence of HEK293T cells treated with vehicle (DMSO), 10 µM Y-27632 for 4 h, 1 µg/ml C3 transferase (C3) for 6 h, or 1 µg/ml Rho activator II (CN03) for 1 h (A). p-MLC2 (Ser19) signal intensity at the plasma membrane over cytosol is normalized to cells treated with vehicle (B; n > 60 cells). (C and D) Immunoblot of HEK293T cells transiently transfected with non-target siRNA (NT) or siRNA targeting GEF-H1 (C). p-ERM over tubulin signals were quantified and normalized to NT treated with vehicle (D). (E) SLK kinase activity measured by an in vitro kinase assay in presence of purified GST-SLK pre-incubated with vehicle (DMSO), 100 nM staurosporine, or 1 µM nocodazole for 15 min. (F–H) Immunofluorescence of HEK293T cells treated with vehicle (DMSO) or 10 nM taxol for 90 min (F). Percentage of metaphase cells was determined (G) based on DNA and tubulin staining (F), and mitotic spindles were classified following the number of apparent centrosomes (monopolar, bipolar, or tri/multi-polar; H). (I and J) Immunofluorescence of HEK293T cells treated with vehicle (DMSO) or 10 nM taxol for 15 min (I). Metaphase cells were identified based on DNA staining (DAPI, blue; arrowheads indicate metaphase cells), and p-ERM signal intensity at the plasma membrane was quantified and normalized to cells treated with vehicle (J; n > 50 cells). (K and L) Immunofluorescence of HEK293T cells stably expressing non-target shRNA (NT) or two independent shRNA targeting GEF-H1 (K). Metaphase and interphase cells were identified based on DNA staining (DAPI, blue; arrowheads indicate metaphase cells), and p-ERM signal intensity at the plasma membrane was quantified and normalized to interphase cells treated with non-target shRNA (L). I, interphase; M, metaphase (n > 55 cells). (M and N) Immunofluorescence of HEK293T cells incubated with vehicle (water) or 1 µg/ml Rho activator II (CN03) for 1 h (M). p-ERM signal intensity at the plasma membrane in metaphase cells was quantified and normalized to cells incubated with vehicle (N; n = 50 cells). Immunofluorescences (A, F, I, K, and M) and immunoblot (C) are representative of at least two independent experiments. All quantifications represent the mean ± SD of at least two independent experiments. Dots represent individual cells (B, J, L, and N) or independent experiments (D, E, and G). P values were calculated using a two-tailed unpaired t test (B, J, and N), using a two-tailed paired t test (G and H), or using Holm-Sidak’s multiple comparisons test with a single pooled variance (D and L), except for comparison made with normalizing condition (NT + vehicle [D]) where one-sample t test was applied. *, P < 0.05; **, P < 0.01; ***, P < 0.001; ****, P < 0.0001. Numbers associated with Western blots indicate molecular weight in kD. Source data are available for this figure: SourceData FS2.

