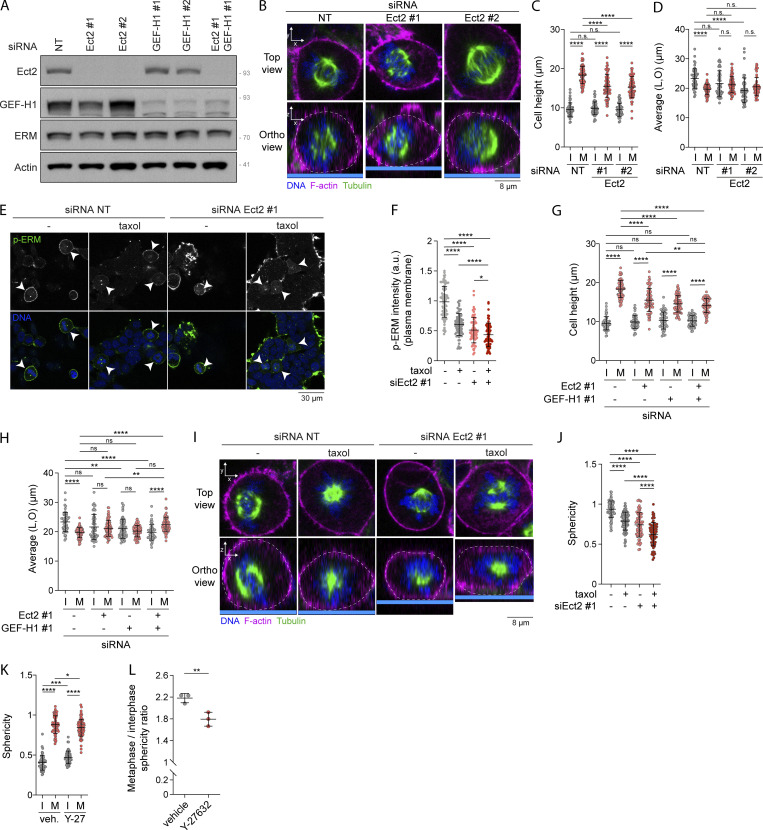
Figure S5.
Ect2 acts together with interphase microtubule disassemblyand GEF-H1 to regulate ERM activity and metaphase cell rounding. (A) Immunoblot of HEK293T cells transiently transfected with non-target siRNA (NT; lane #1), two independent siRNA targeting Ect2 (lanes #2 and #3), or GEF-H1 (lanes #4 and #5), or transfected with a combination of siRNA targeting Ect2 and GEF-H1 (lane #6). (B–D) Cell height (C) and cell shape within the x/y plane (D) were measured using immunofluorescence 3D reconstitution after confocal microscopy (B) in HEK293T cells transiently transfected with non-target siRNA (NT) or two independent siRNA targeting Ect2 (n > 55 cells). (E and F) Immunofluorescence of HEK293T cells transiently transfected with non-target siRNA (NT) or siRNA targeting Ect2 and incubated with vehicle (DMSO) or 10 nM taxol for 90 min. Metaphase cells were identified based on DNA staining (DAPI, blue; E; arrowheads indicate metaphase cells), and p-ERM signal intensity at the plasma membrane in metaphase cells was quantified and normalized to cells transfected with non-target siRNA and incubated with vehicle (F). Quantification of p-ERM signal intensity of metaphase cells transiently transfected with non-target siRNA (NT) or siRNA #1 targeting Ect2 (Ect2 #1) was already shown in Fig. 7 B (n > 70 cells). (G and H) Cell height (G) and cell shape within the x/y plane (H) were measured in HEK293T cells transiently transfected with non-target siRNA (NT), siRNA targeting Ect2 or GEF-H1, or with a combination of siRNA targeting Ect2 and GEF-H1 (n > 55 cells). (I and J) Sphericity was measured using immunofluorescence 3D reconstitution after confocal microscopy (I) in HEK293T cells transfected with non-target siRNA (NT) or siRNA targeting Ect2 and incubated with vehicle (DMSO) or 10 nM taxol for 90 min. Sphericity was measured as in Fig. 3 G (J). Sphericity of metaphase cells transiently transfected with non-target siRNA (NT) or siRNA #1 targeting Ect2 (Ect2 #1; J) was already shown in Fig. 7 C (n > 60 cells). (K and L) Sphericity (K) and mitotic rounding defects (L) were measured using immunofluorescence 3D reconstitution after confocal microscopy (see Fig. 7 J) in HEK293T cells incubated with vehicle (DMSO) or 10 µM Y-27632 for 4 h. Sphericity was measured as in Fig. 3 G (K). Mitotic rounding defects were assessed by measuring the mean sphericity ratio of metaphase to interphase cell populations (L) (n > 55 cells). I, interphase; M, metaphase. Immunoblot (A) and immunofluorescences (B, E, and I) are representative of three independent experiments. All quantifications represent the mean ± SD of three independent experiments. Dots represent individual cells (C, D, F–H, J, and K) or independent experiments (L). P values were calculated using Holm-Sidak’s multiple comparisons test with a single pooled variance (C, D, F–H, J, and K) or two-tailed paired t test (L). *, P < 0.05; **, P < 0.01; ***, P < 0.001; ****, P < 0.0001. Numbers associated with Western blots indicate molecular weight in kD. Source data are available for this figure: SourceData FS5.

