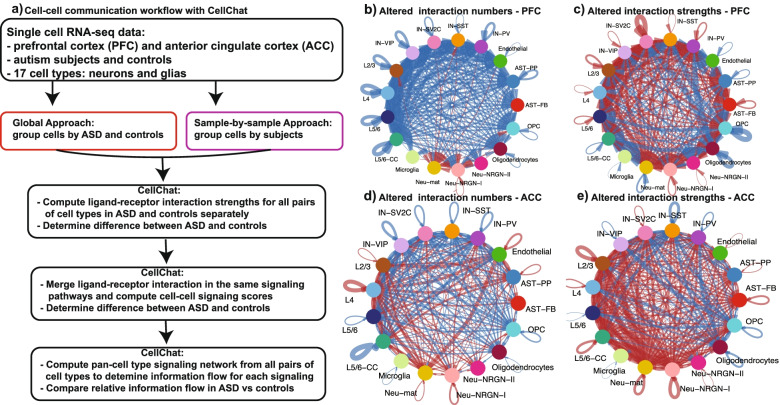
Fig. 1.
Change in communication between individual pairs of cell types in ASD. a Computational workflow of key analytic steps. b Difference in the total numbers of L-R interactions in ASD vs control PFC. c Difference in the total strengths of L-R interactions in ASD vs control PFC. d Difference in the total numbers of L-R interactions in ASD vs control ACC. e Difference in the total strengths of L-R interactions in ASD vs control PFC. In b–e, lines indicate the changes in individual pairs of cell types, with red for increase and blue for decrease in ASD. The thickness of the lines represents the extent of changes, with the maximal corresponding to 28 in b/d and 0.36 in c/e

