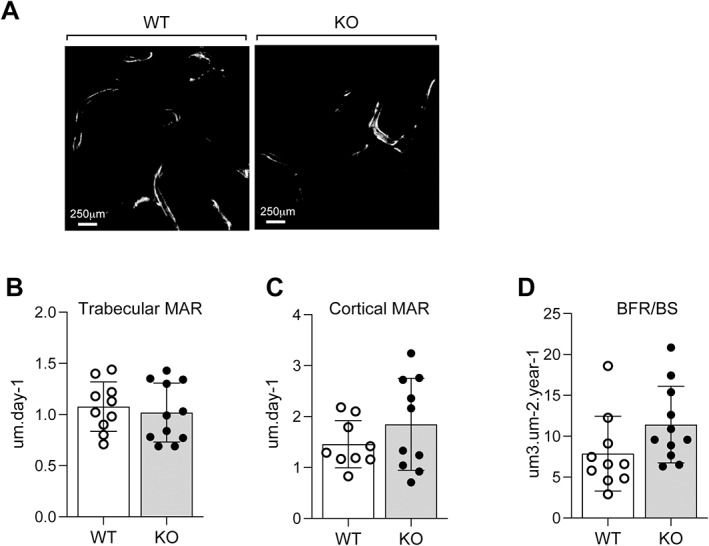
Fig. 6.

Dynamic histomorphometric analysis. (A) Representative unstained polymethylmethacrylate (PMMA)‐embedded femur sections of 6‐month‐old WT and KO females examined under fluorescent light to visualize double‐calcein labeling; scale bar = 250 μm. Indices of bone formation calculated were: (B) trabecular mineral apposition rate (MAR), (C) cortical MAR, and (D) the bone formation rate/bone surface (BFR/BS). Each value is the mean ± SD of 10 (WT) and 11 (KO) determinations.
