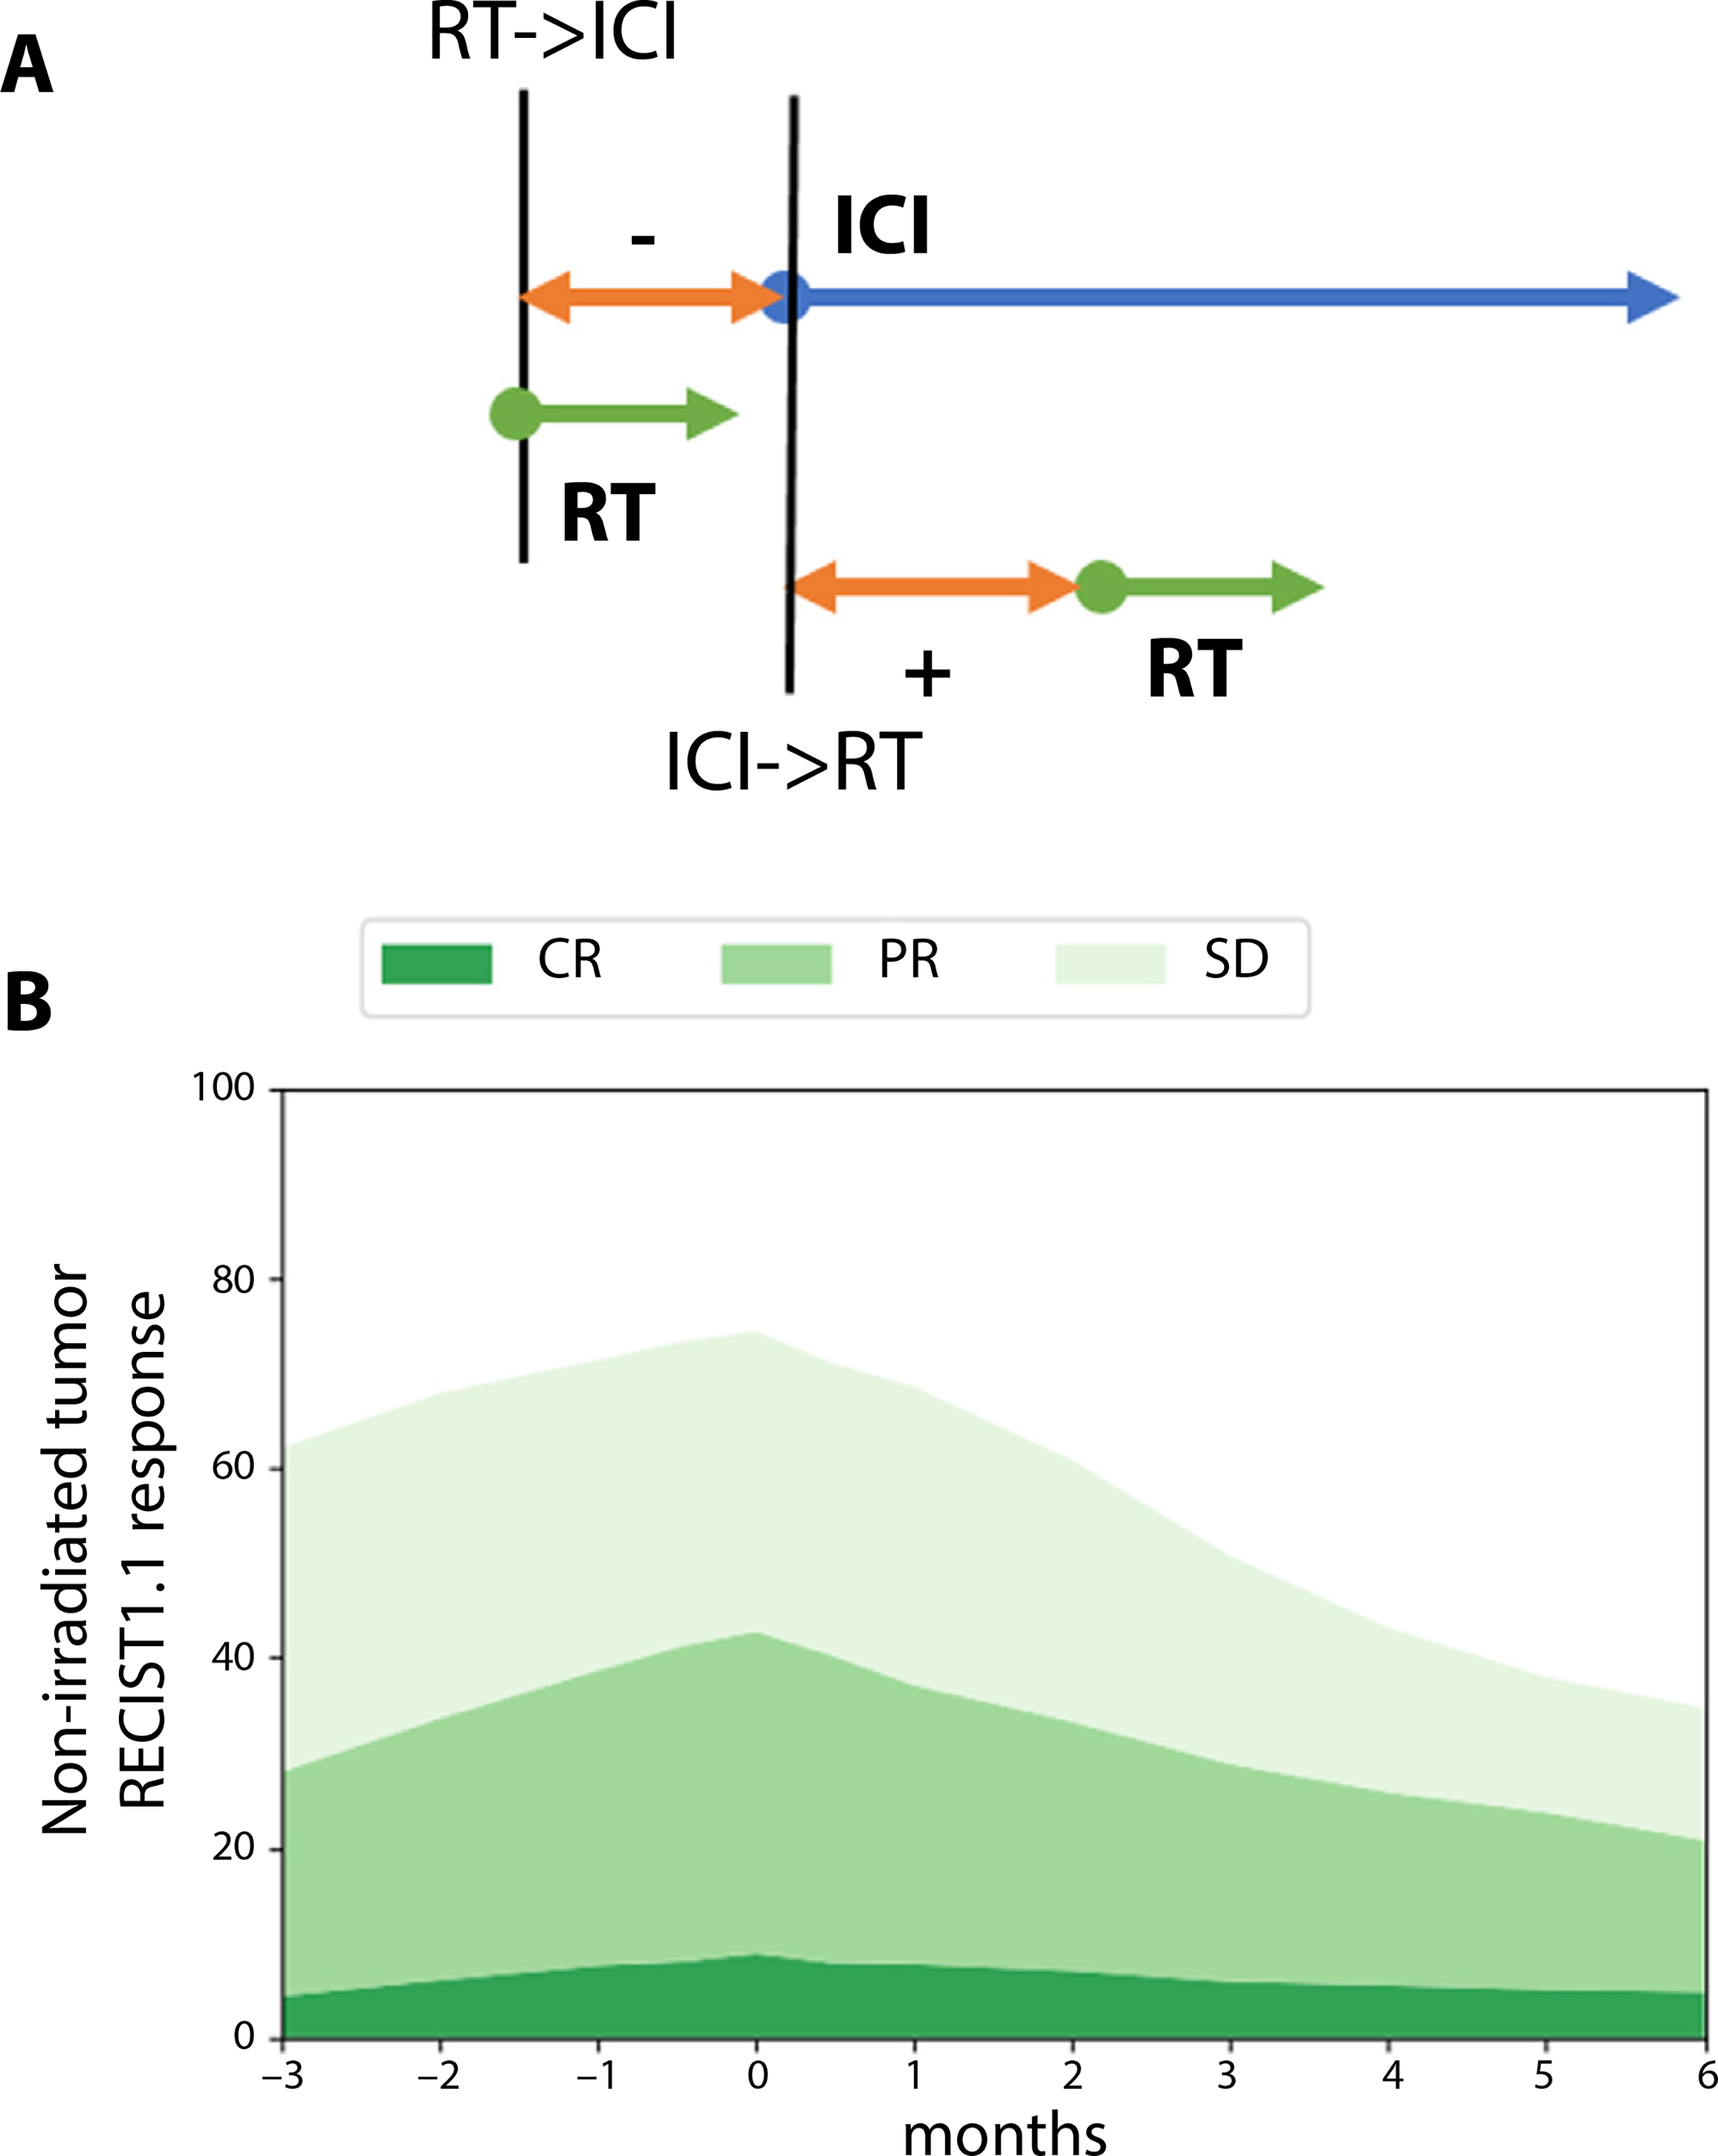
Fig. 3.

Predicted treatment outcomes with different combination sequences. (A) Schematic providing the key for 3B: negative values on the time axis indicate RT started before immune checkpoint inhibitors, positive values indicate after immune checkpoint inhibitors. (B) Response rates as a function of radiation therapy start time for nonirradiated tumor. Radiation therapy is delivered as 8 Gy × 3 to 90% of the tumor burden, that is, this case corresponds to the 90% irradiated tumor fraction case in Figure 1. Abbreviations: CR = complete response; ICI = immune checkpoint inhibitor; PR = partial response; RT = radiation therapy; SD = stable disease.
