
Figure 1.
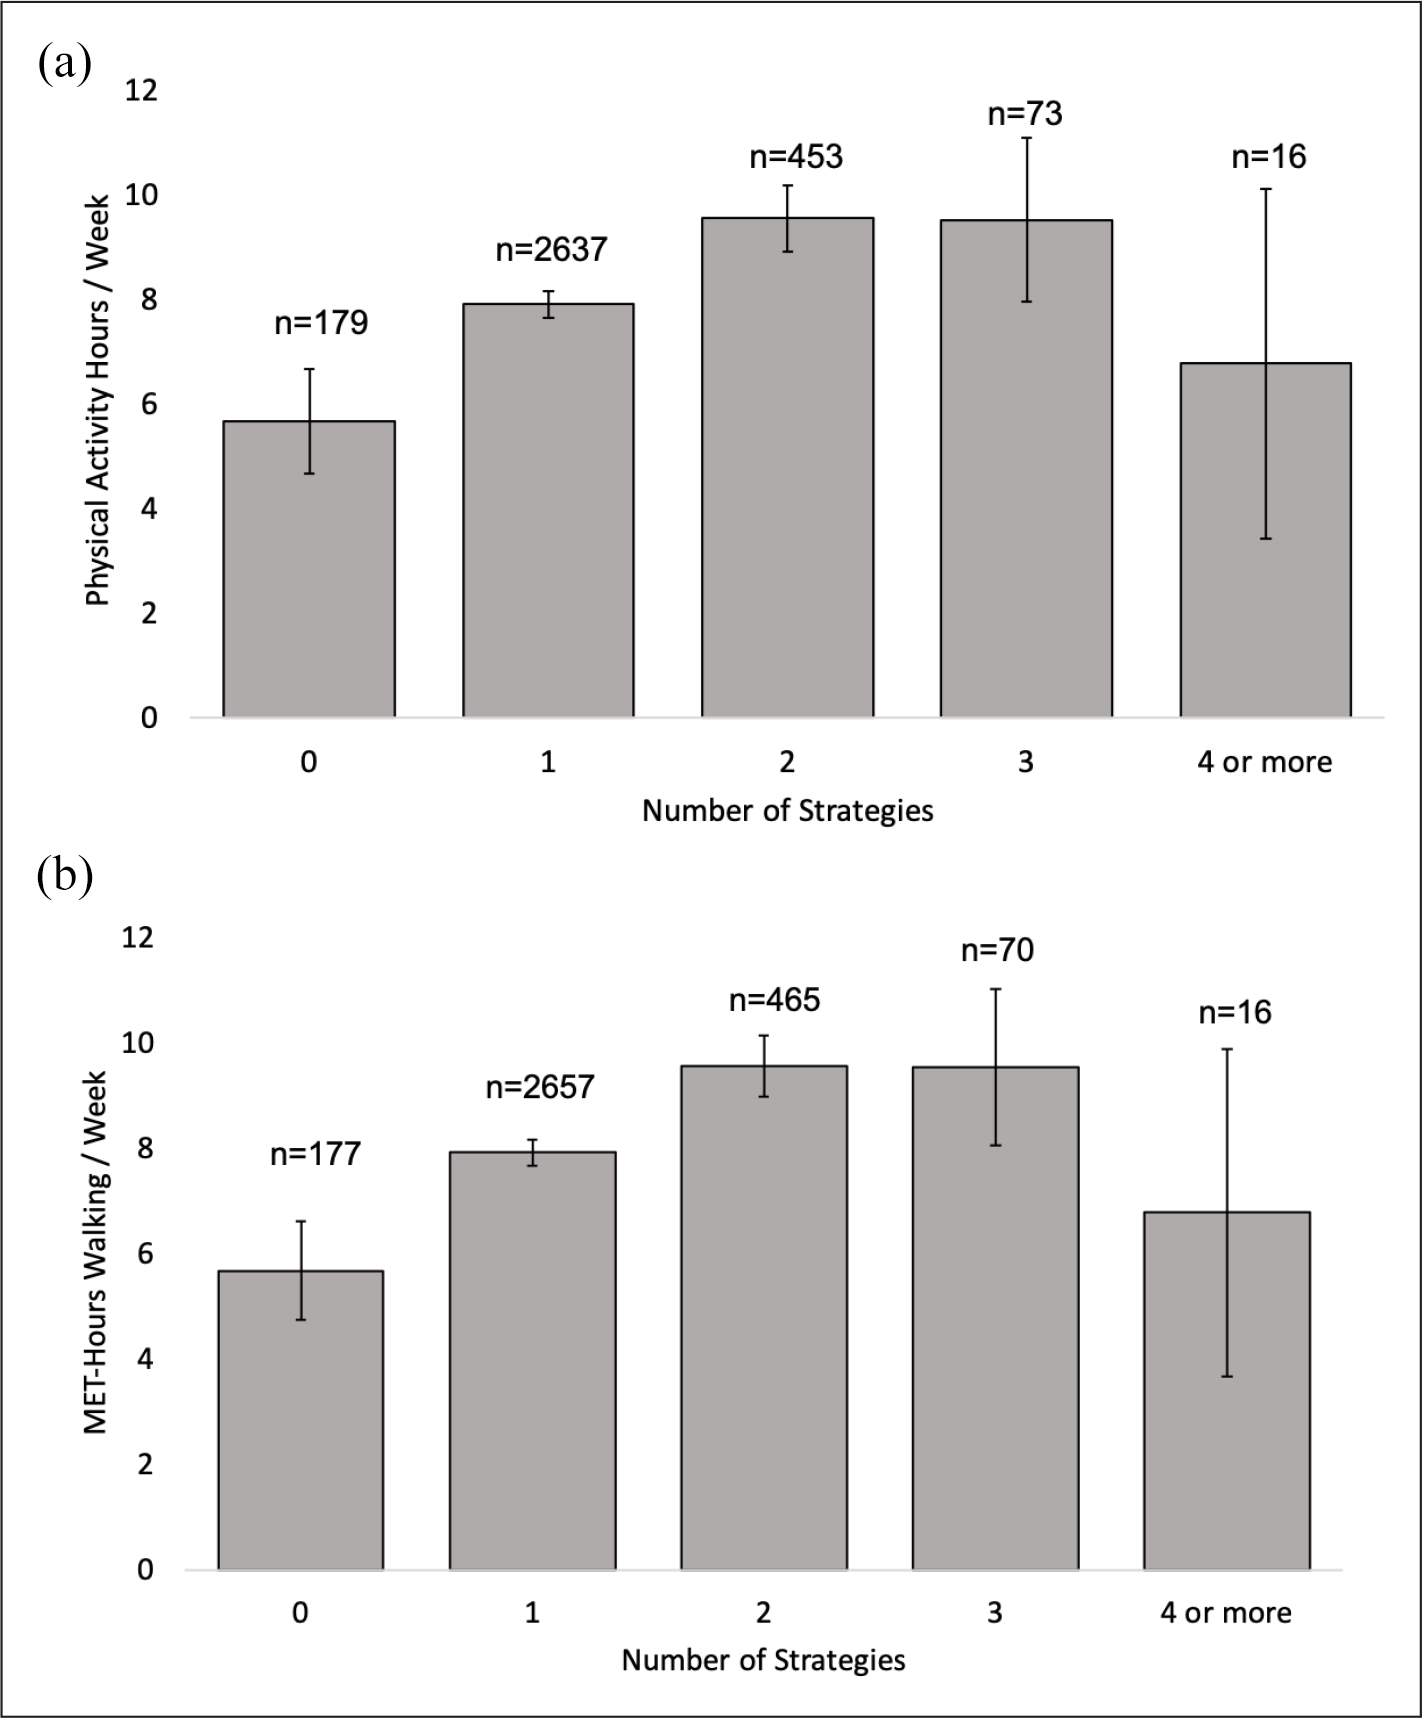
(a) Physical activity hours per week × number of strategies. (b) MET-hours of walking per week × number of strategies.
Error bars represent 95% confidence intervals. Sample size n’s refer to number of women who reported that number of strategies.