
Figure 2.
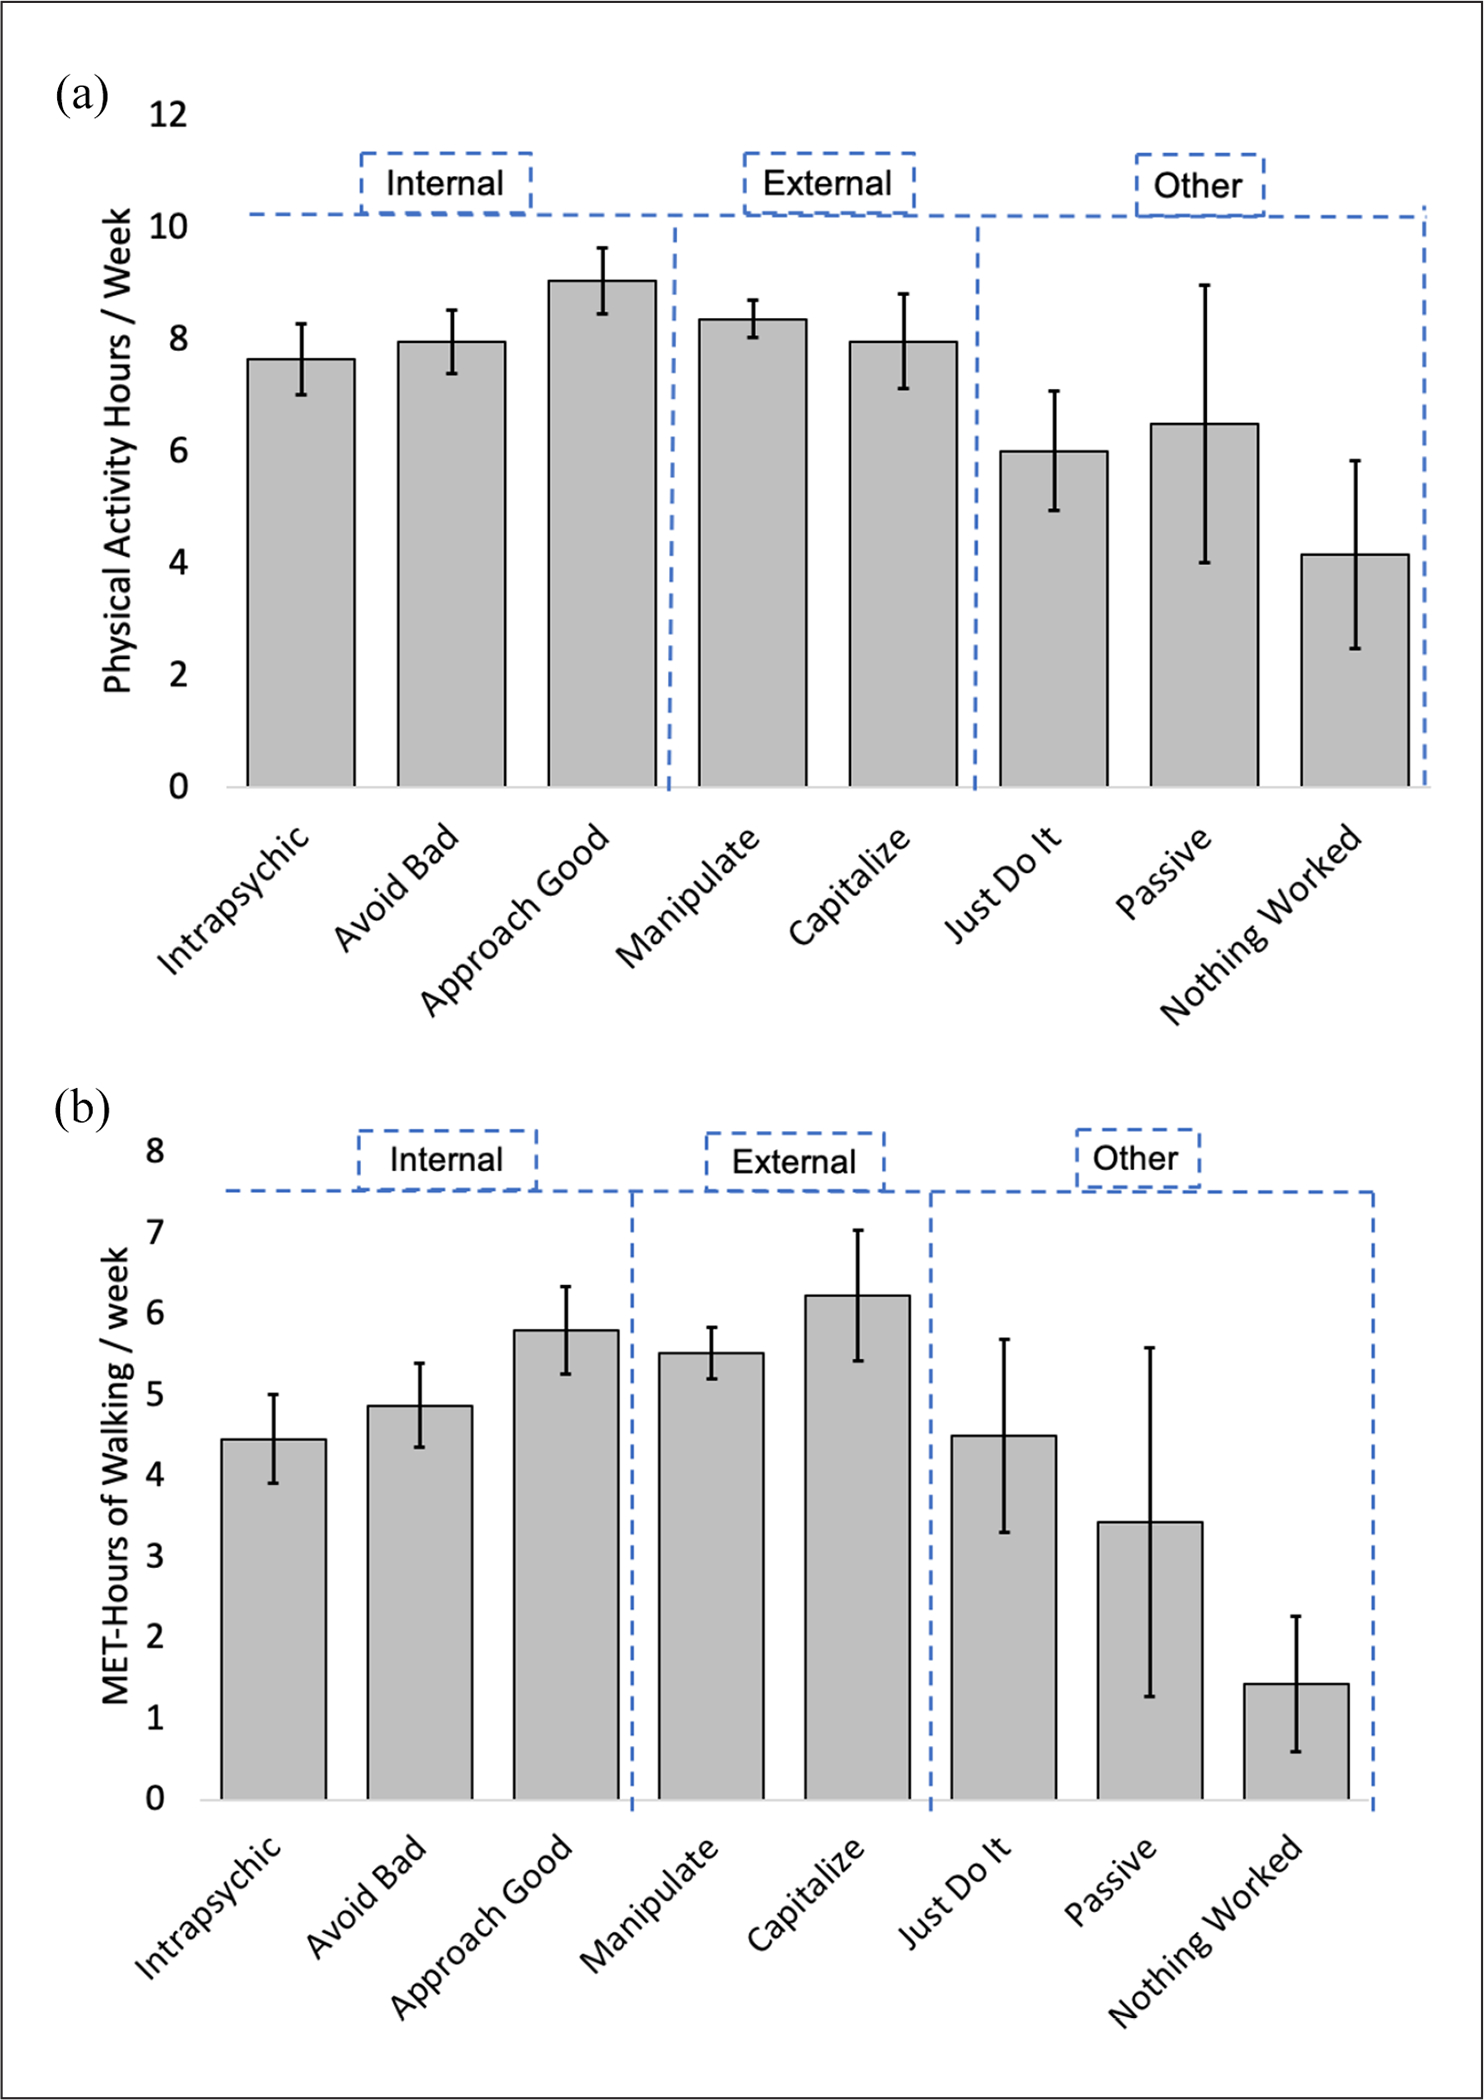
(a) Average physical activity hours per week × strategy category. (b) Average MET-hours of walking per week × strategy category.
Error bars represent 95% confidence intervals. If a participant reported both an avoid bad and approach good, her physical activity score would contribute to each subcategory’s average.