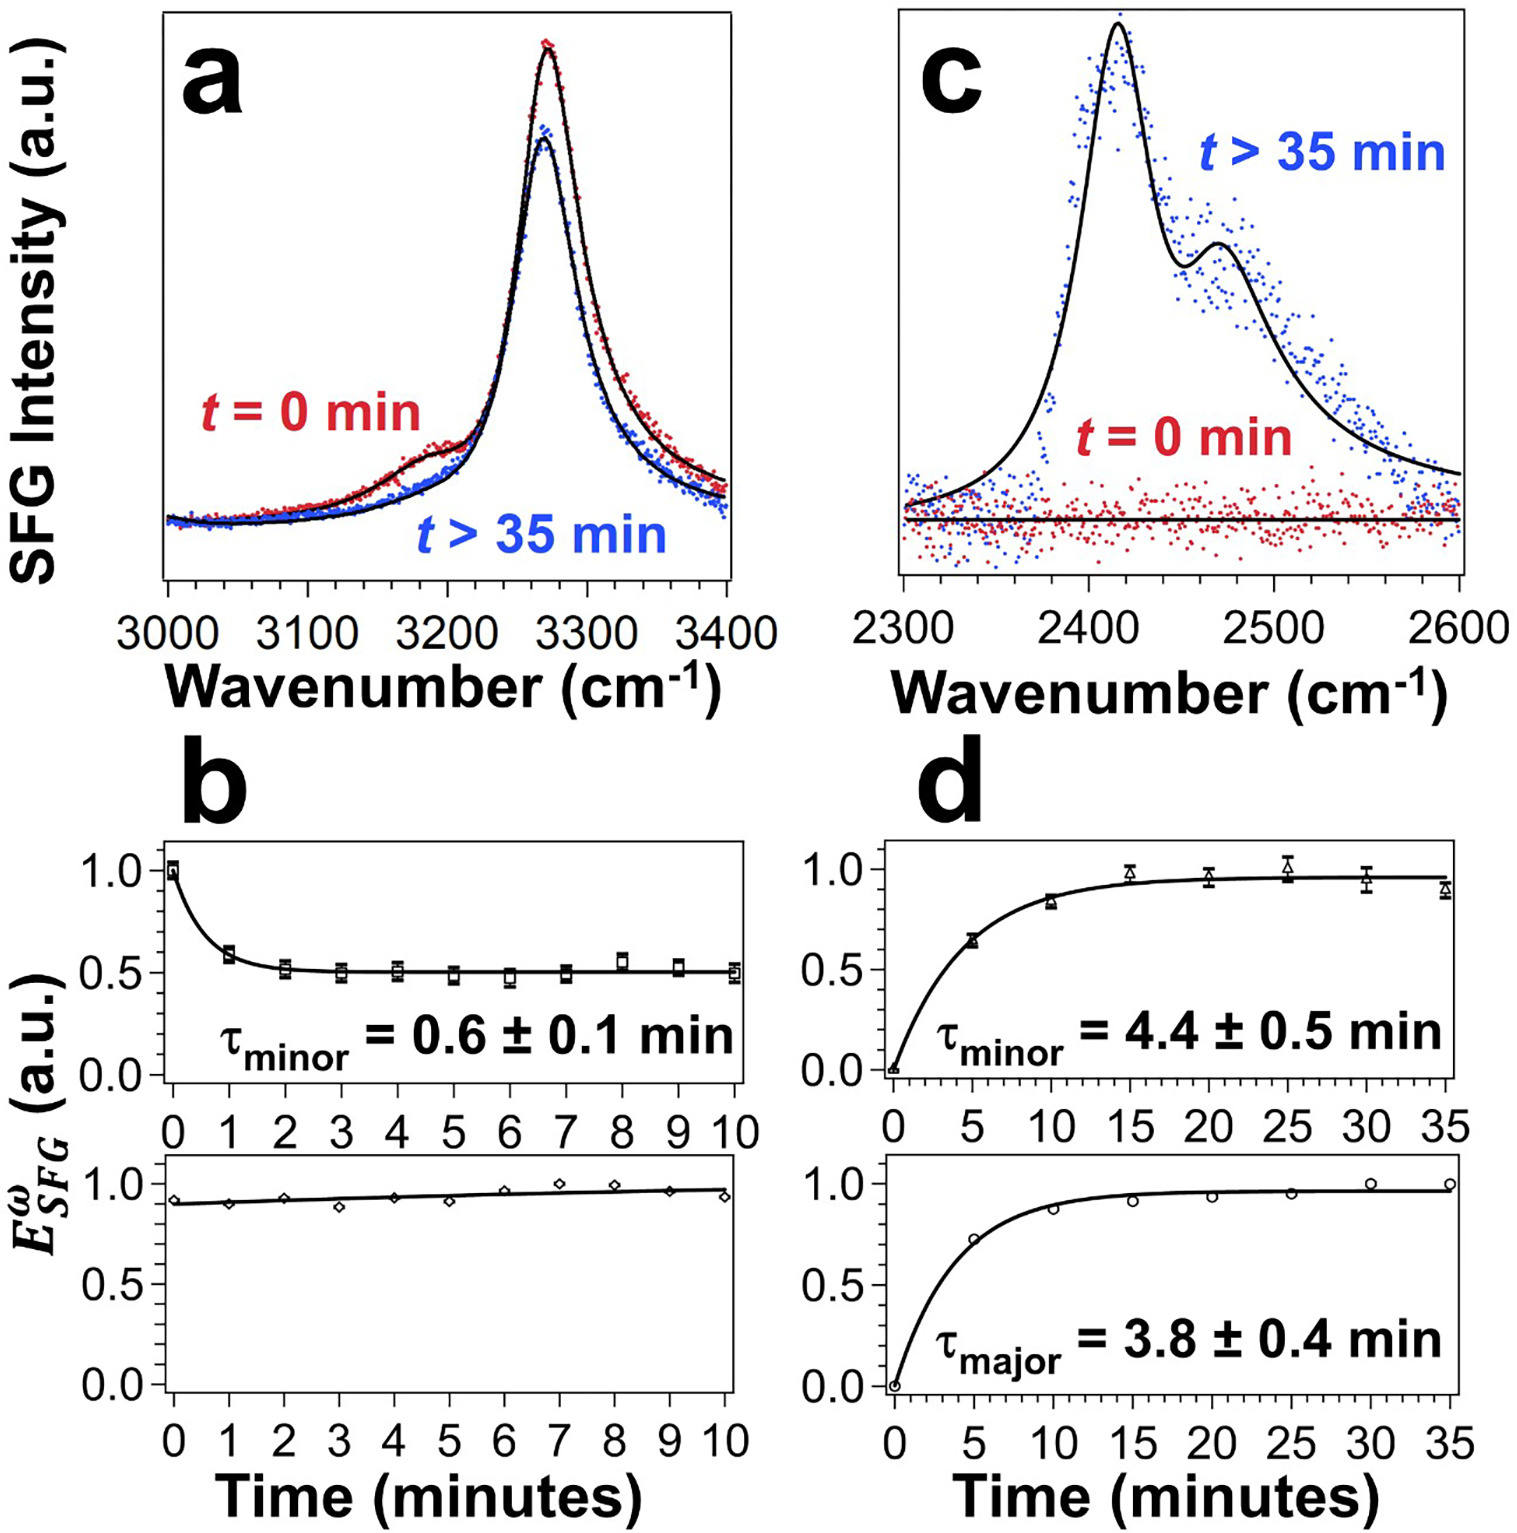
Figure 5.

H2O-to-D2O exchange via the vapor phase monitored by chiral SFG. (a) Response in the O-H/N-H region (red) before and (blue) after exposure to D2O vapor. See Figure S5 and Table S3 for fittings of time-dependent spectra. (b) Amplitudes over time for the minor peak at 3191 cm−1 (top) and major peak at 3269 cm−1 (bottom). (c) Response in the O-D region before and after exposure to D2O vapor. (d) Amplitudes over time for the minor peak at 2401 cm−1 (top) and major peak at 2454 cm−1 (bottom). Solid lines in (b) and (d) are single exponential fits.
