. 2019 Jan 2;9(1):543–551. doi: 10.1039/c8ra07416j

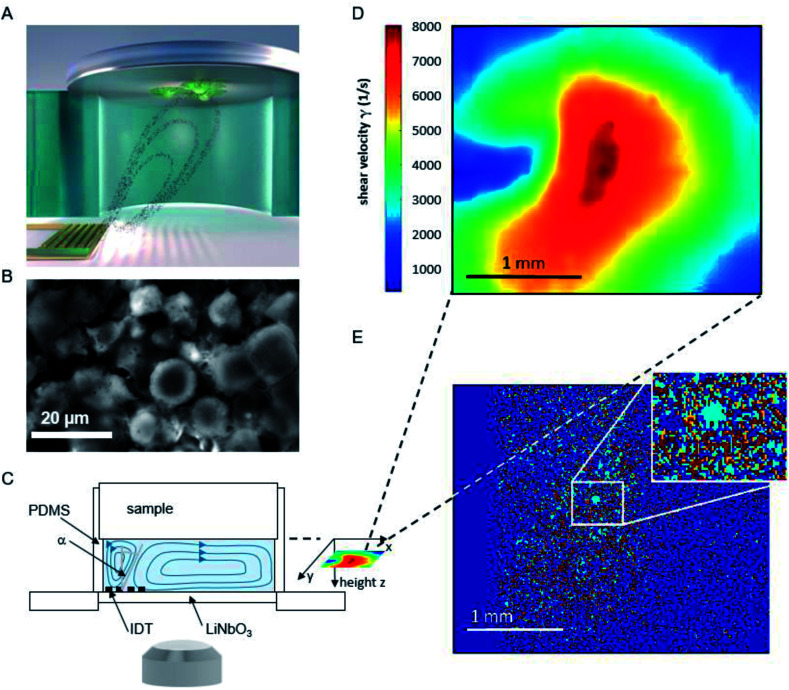
Fig. 1. (A) Schematic illustration of the setup and sketched microfluidic streaming pattern generated by the interdigital transducer (golden comb like structure). (B) Micrograph of adhered cells on a titanium substrate. (C) Side view of the setup (D) shear map calculated from the sPIV measurement for a rf power of 28 dBm. (E) Superposition of the micrographs before and after 60 minutes of flow experiment. To visualize the difference in cell coverage of the substrate, the light blue area describes positions where cells detached, while red areas represent immobile cells. Area unoccupied by cells at the start of the experiment, but occupied at the end of the measurement, are colored orange.

Fig. 1