
Fig. 1. Whole-Brain Alcohol vs. Beverage Results.
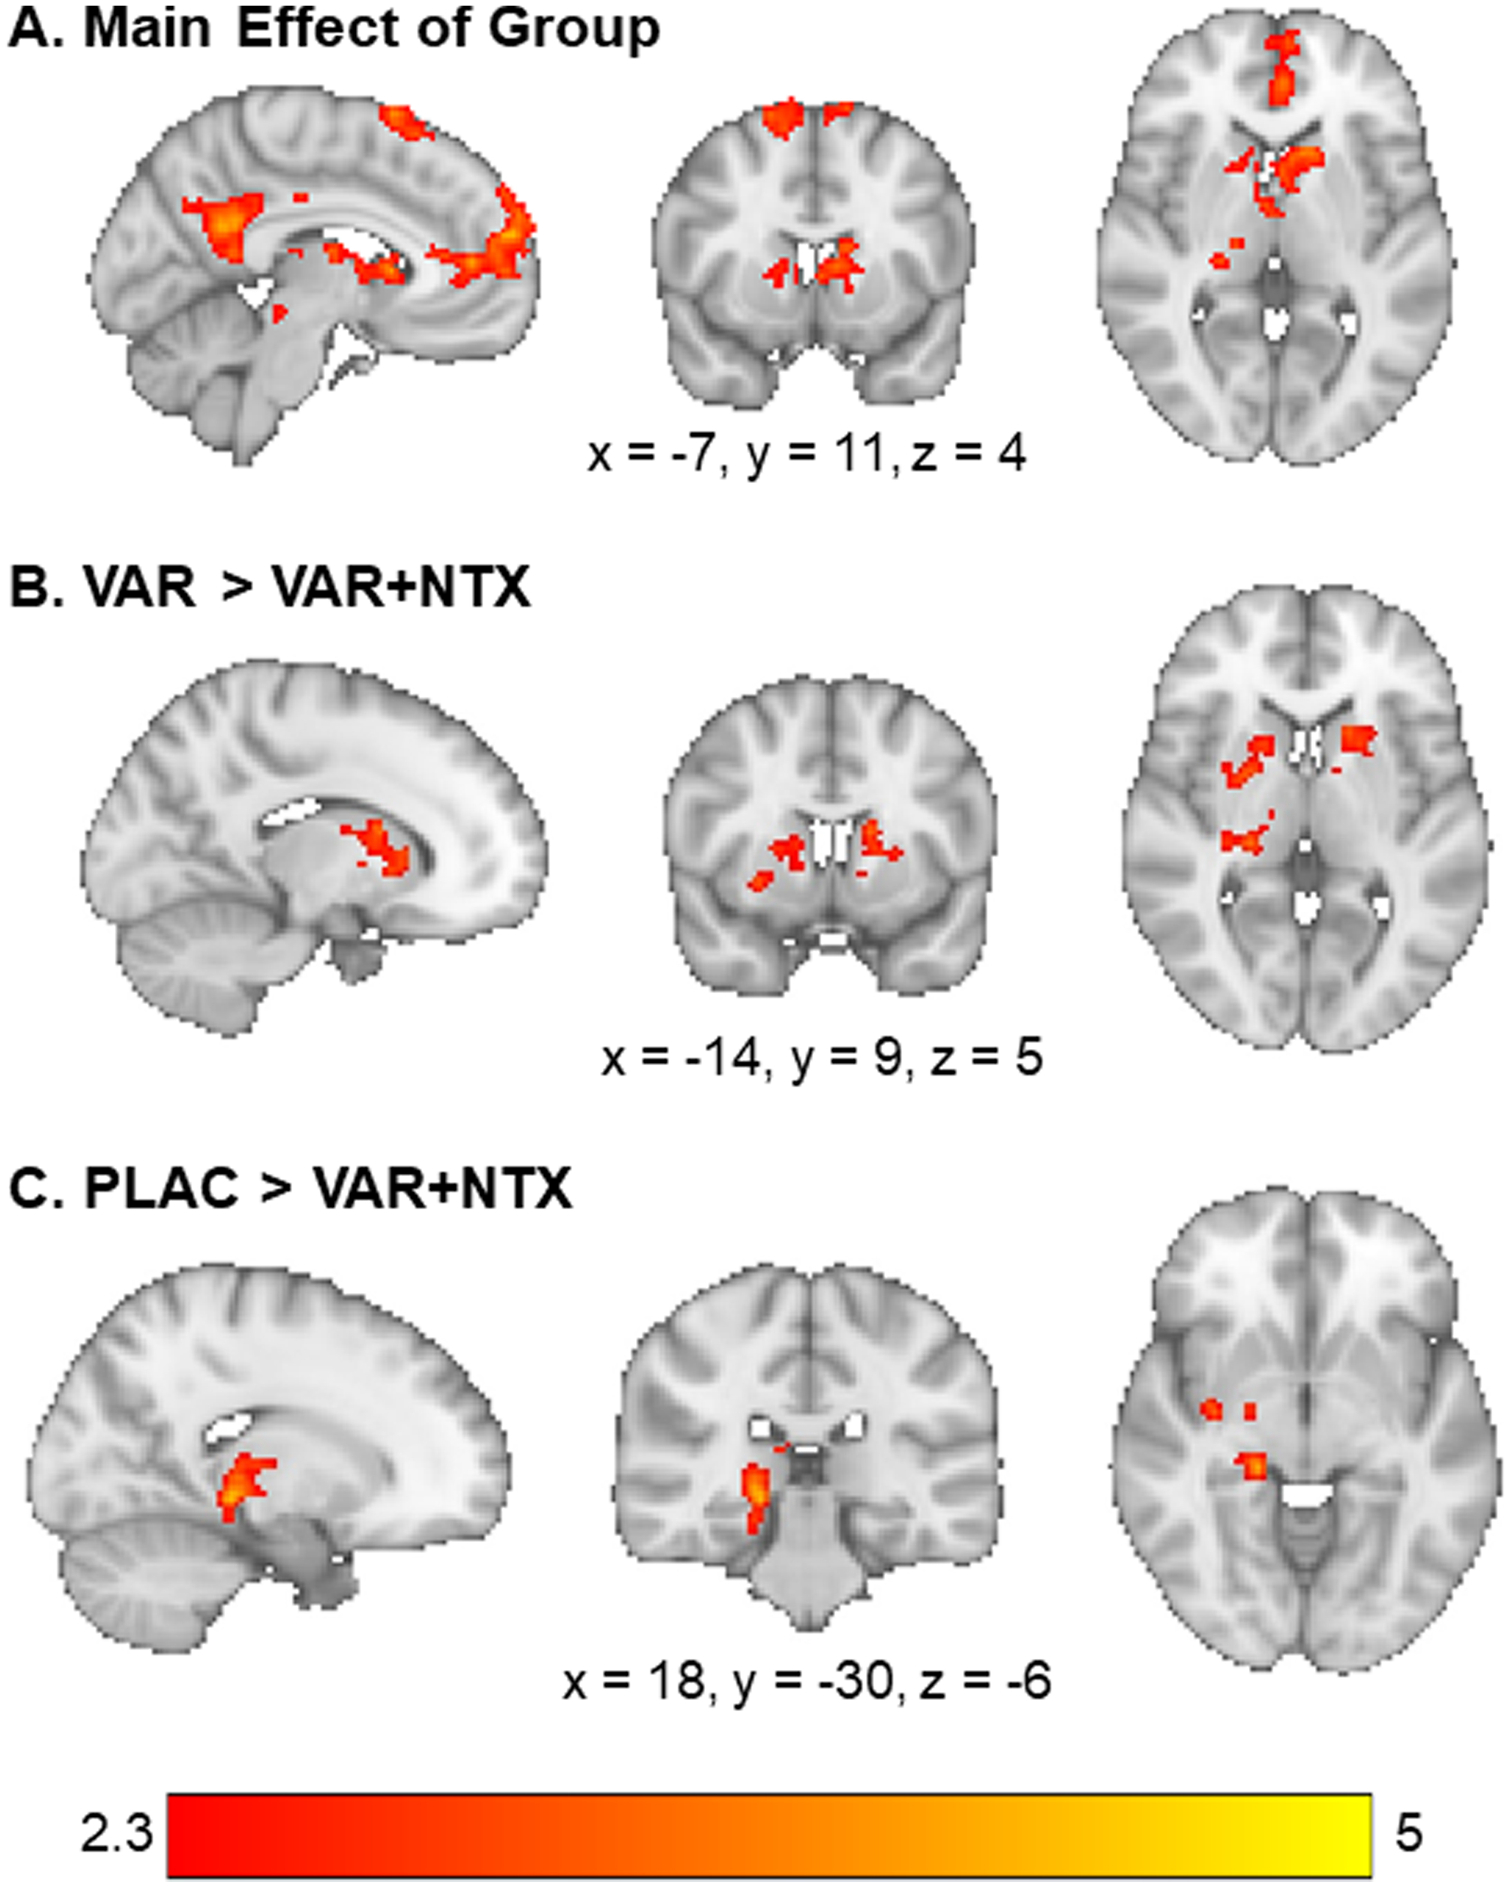
(A) There was a main effect of group on activation to alcohol vs, beverage cues in the medial prefrontal cortex, cingulate gyrus, caudate, and midbrain. (B) The varenicline only group had higher activation to alcohol vs. beverage cues in the caudate and thalamus relative to the varenicline + naltrexone group. (C) The placebo group had higher activation to alcohol vs. beverage cues in the thalamus, parahippocampus, and hippocampus, relative to the varenicline + naltrexone group. Z-statistic maps are whole-brain cluster corrected, Z > 2.3, p = .05. Coordinates are in Montreal Neurological Institute space. Brain is displayed in radiological convention (L=R).