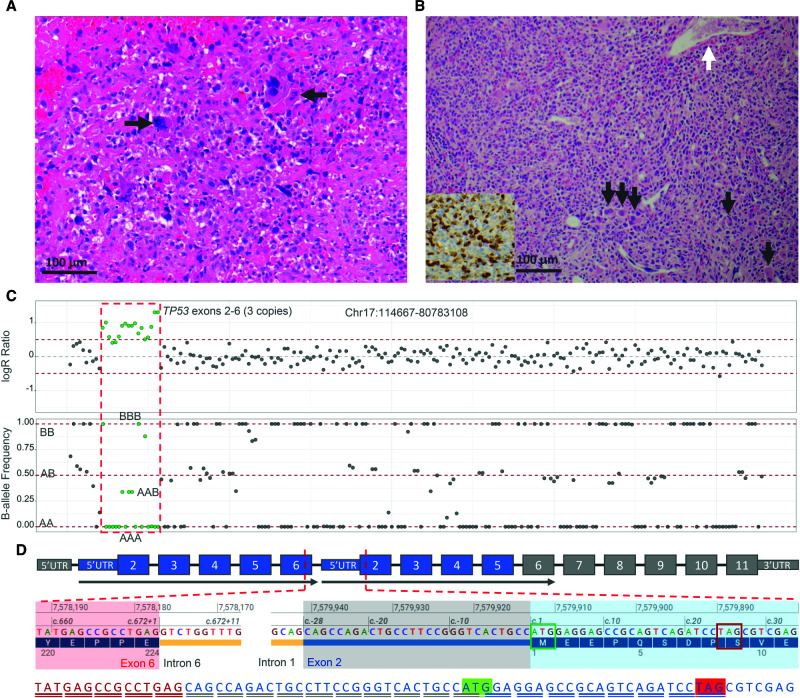
Figure 1.
(A) Histologic section of the osteosarcoma prior to chemotherapy stained with hematoxylin and eosin demonstrates proliferation of large pleomorphic cells with enlarged, hyperchromatic nuclei, and frequent atypical mitotic figures (arrows) associated with osteoid matrix (arrowhead). (B) Bone marrow biopsy shows hypercellular marrow for age (>95%) with variably sized atypical mononuclear cells with irregular nuclei and ample cytoplasm. Maturing myeloid and erythroid elements are markedly decreased. Small hypolobated dysplastic megakaryocytes are seen throughout the marrow (black arrows), and underlying fibrosis is suggested by the overall streaming pattern of the cells and the dilated bone marrow sinuses (white arrow). An immunohistochemical stain for myeloperoxidase is positive in a subset of the atypical cells (inset). (C) Next-generation sequencing (NGS) copy-number analysis displays a heterozygous duplication of partial TP53 in the patient's blood sample. The green dots in the logR ratio plot represent the TP53 exon 2–6 duplication with increased logR ratio. The gray dots represent the rest of Chr 17 with normal logR ratio. In the B-allele frequency plot, green dots show the single-nucleotide polymorphism (SNP) patterns of three copies of the duplication as AAA, AAB, ABB, and BBB, whereas the rest of the SNPs in gray are two copies delineated as AA, BB, or AB alleles. (D) Schematic illustration of the tandem duplication of TP53 exons 2–6. Partial cDNA sequence identified by RNA-seq is illustrated in red with red underline (exon 6), blue with gray underline (28 nt of 5′ UTR upstream of the start codon of exon 2), and blue with blue underline (exon 2). The start codon is marked in green, and the stop codon is marked in red.

