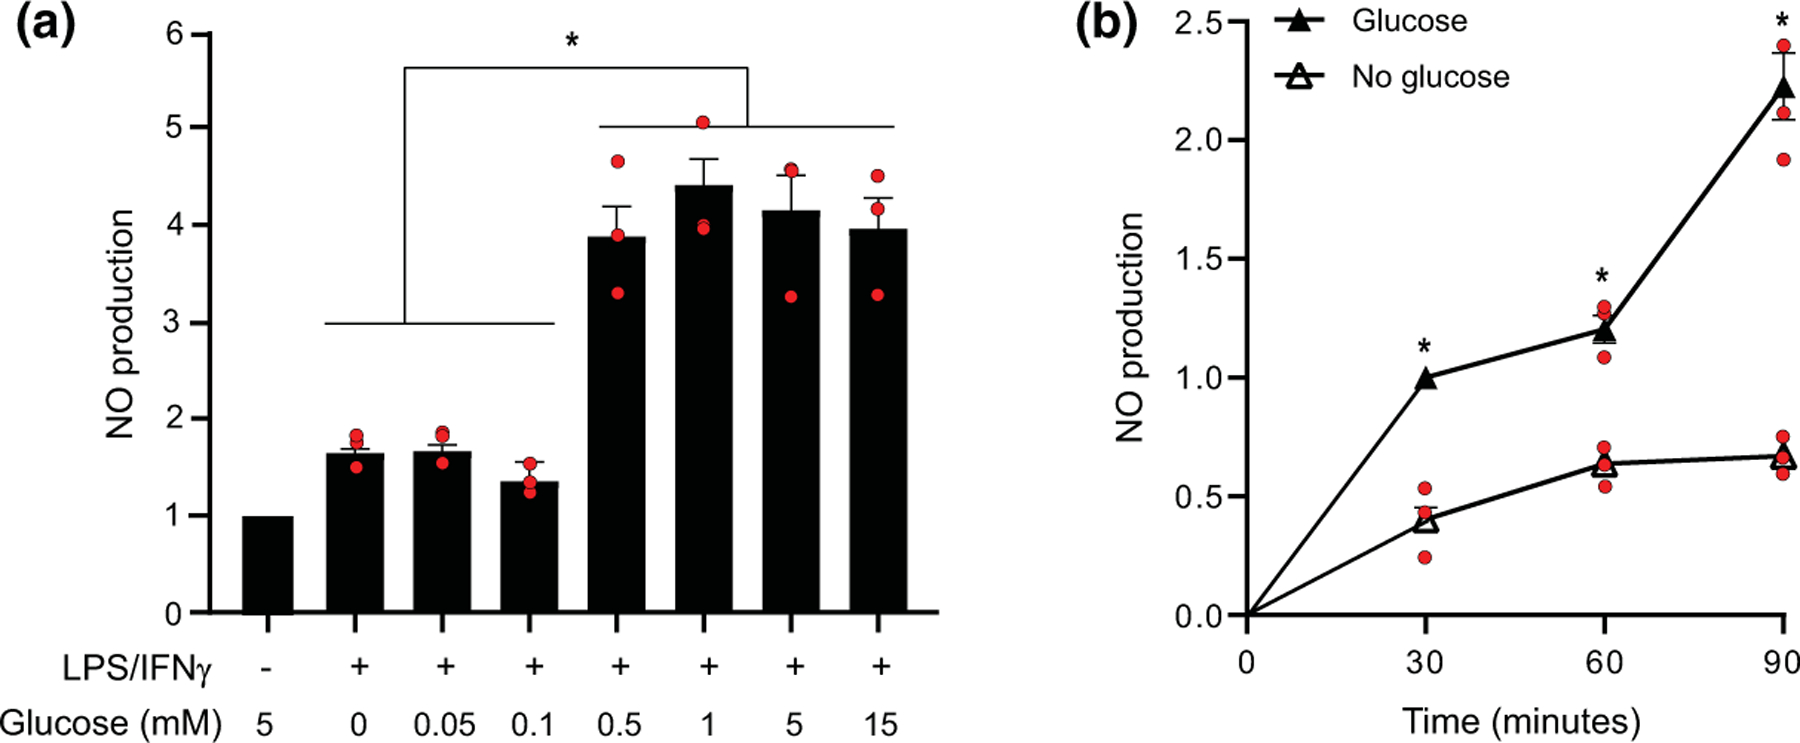
FIGURE 4.

Effects of glucose concentration and incubation times on NO production. (A) Reductions in NO production were observed at medium glucose concentrations of 0.1 mM and lower. Data from each experiment are normalized to the control condition (5 mM glucose, not stimulated by LPS/INFγ) and expressed as means ± SEM. n = 3 experiments, each performed with independent culture preparations. *p < 0.05 by ANOVA and Sidak’s test [F(6, 14) = 21.16, p < 0.0001’ r2 = 0.900; Browne–Forsythe F = 0.671, p = 0.675]. (b) Cumulative NO production measured at 30 min intervals in cultures incubated with and without 5 mM glucose after LPS/INFγ stimulation. Values are expressed relative to the control condition (not stimulated by LPS/INFγ or deprived of glucose). Data from each experiment are normalized to the control condition (5 mM glucose, not stimulated by LPS/INFγ) and expressed as means ± SEM. n = 3 experiments, each performed with independent culture preparations. *p < 0.05 by ANOVA and Sidak’s test. [F(5, 12) = 64.8’ p < 0.0001, r2 = 0.964; Browne–Forsythe F = 1.259, p = 0.342]
