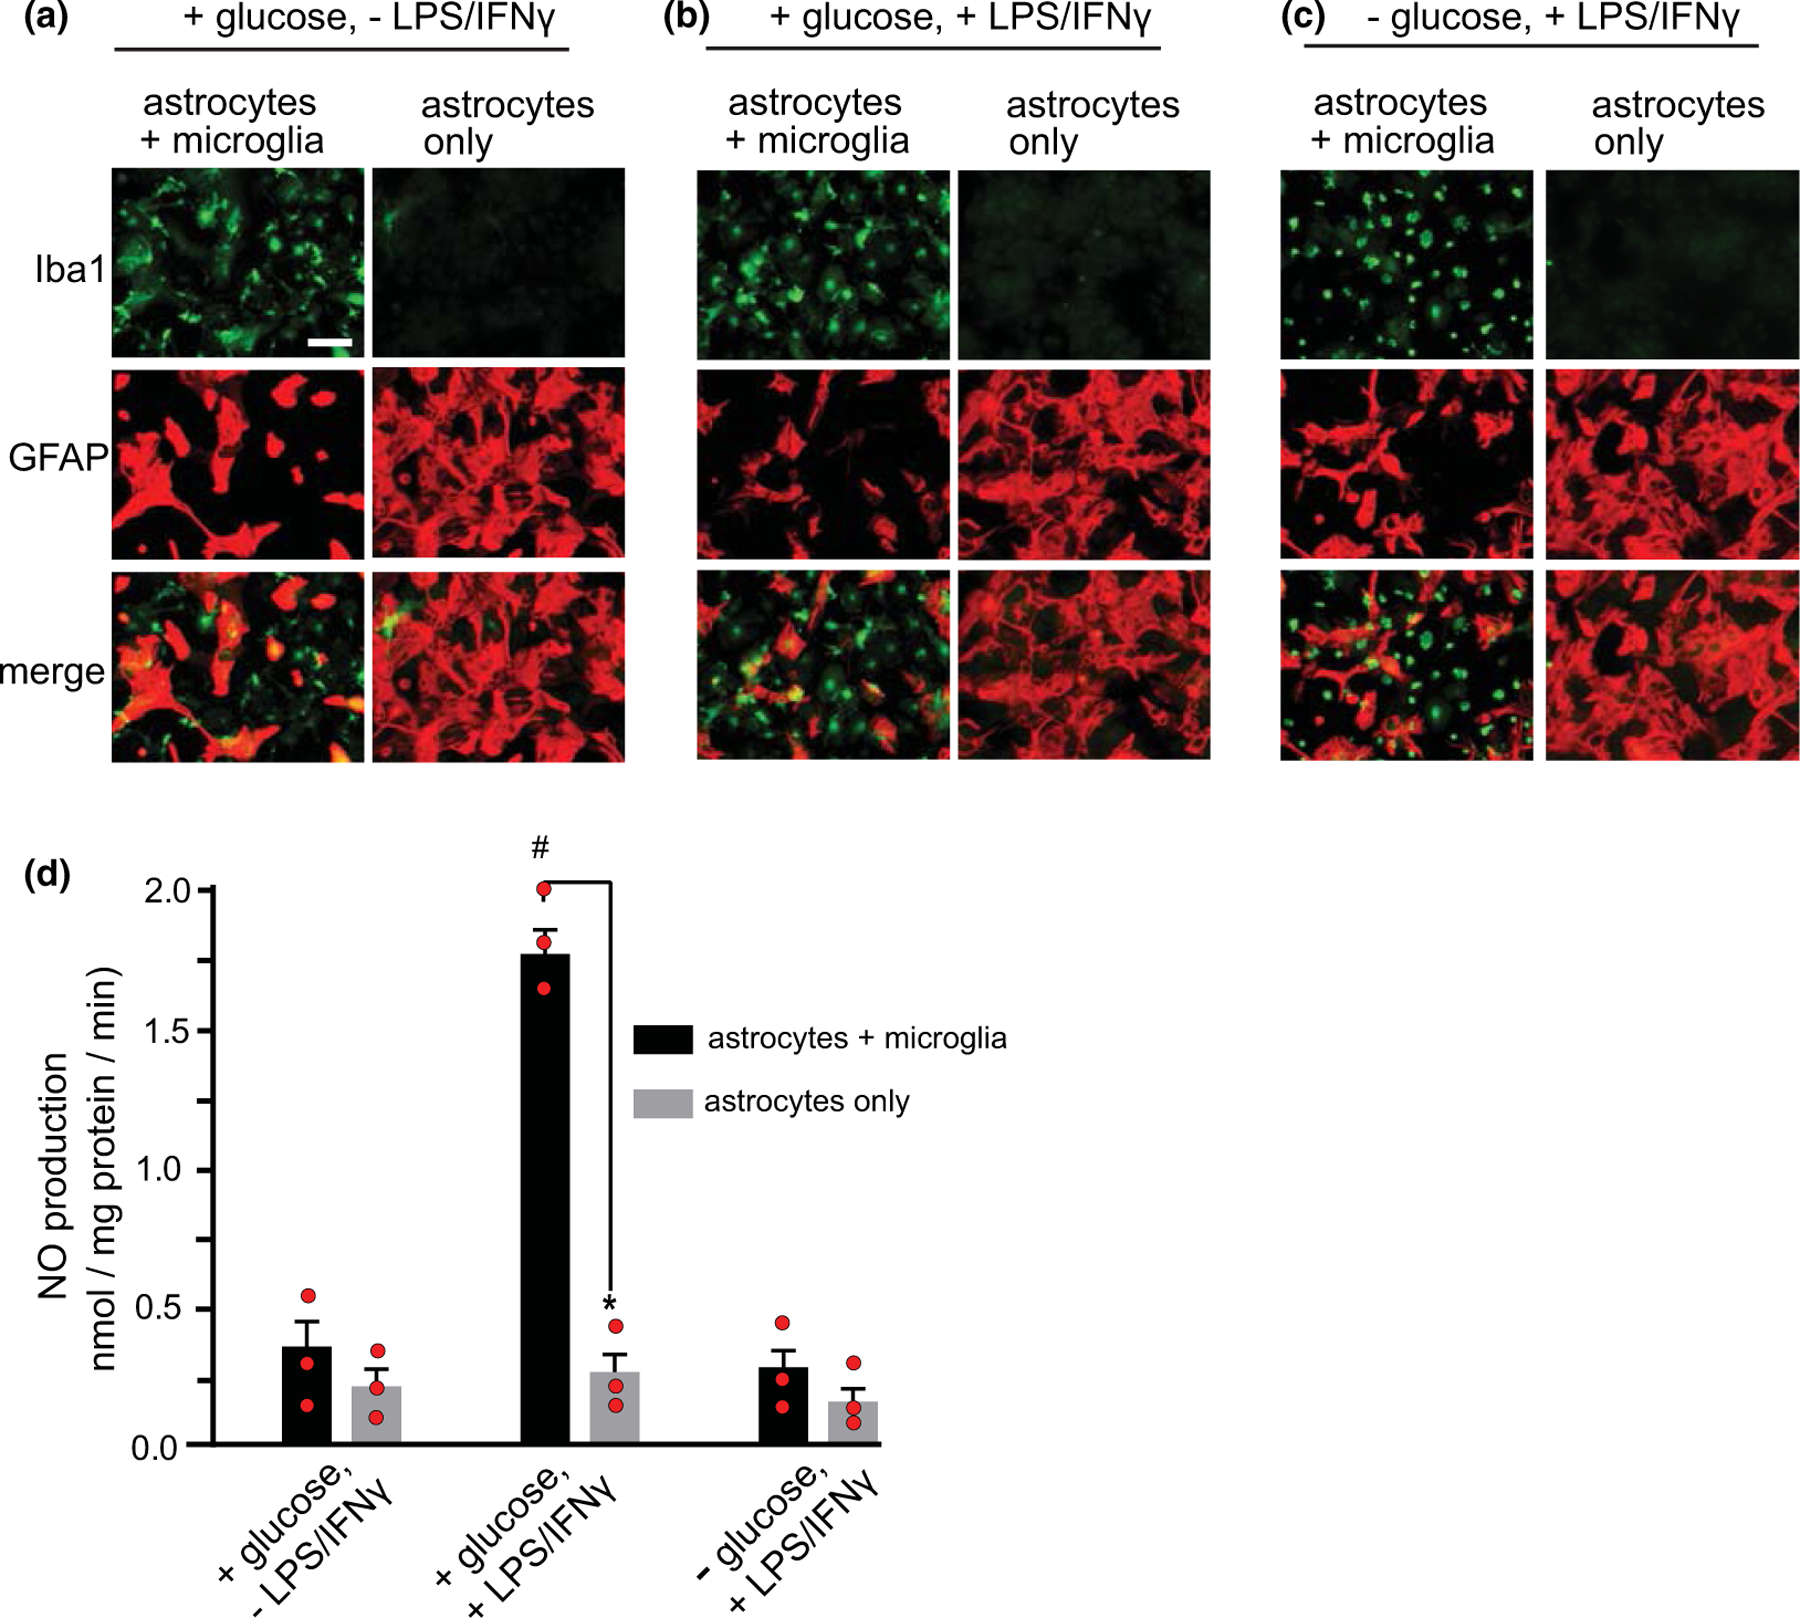
FIGURE 5.

Comparisons between mixed glial cultures and astrocyte monocultures. (a–c) Cultures are immunostained for the microglial marker Iba1 (green) and the astrocyte marker GFAP (red). Scale bar = 50 µm. Cultures were fixed after 18 h treatment with or without LPS/IFNγ and 90 min incubation in 0 glucose or 5 mM glucose medium. (d) NO production under the conditions (a–c). Data are means ± SEM; n = 3 experiments, each performed with independent culture preparations of both types. *p < 0.01 versus astrocytes plus microglia; #p < 0.01 versus astrocytes +microglia under the other treatment conditions, by ANOVA and Sidak’s test. [F(5, 12) = 56.6, p < 0.0001, r2 = 0.959; Browne–Forsythe F = 0.039, p = 0.999]
