. 2019 Jan 21;9(5):2857–2864. doi: 10.1039/c8ra08818g

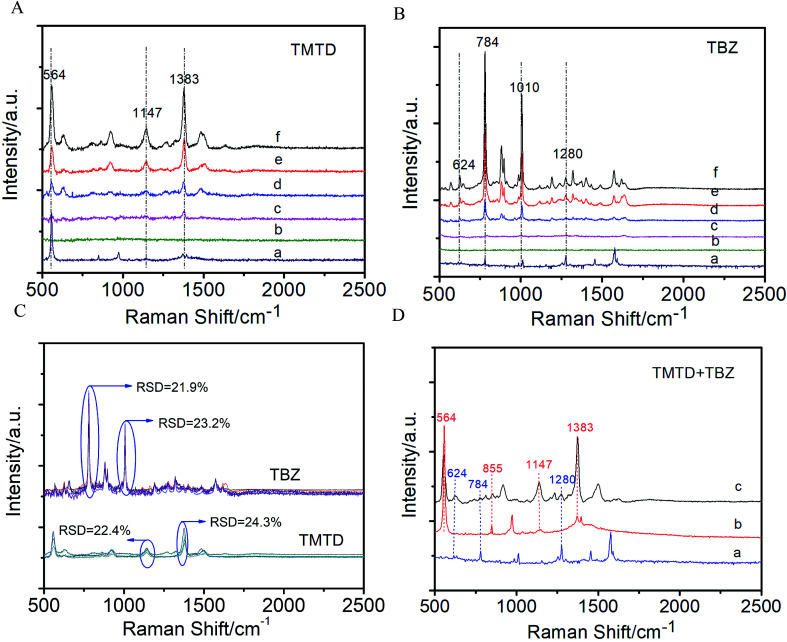
Fig. 5. Raman spectra of (A) TMTD and (B) TBZ: (a) normal Raman band of solid pesticides powder, (b) normal Raman band of 0.1 mM corresponding pesticide on the surface of the apple pieces, (c–f) SERS spectra of different concentrations of TMTD ((c) 18.05 ng cm−2, (d) 36.10 ng cm−2, (e) 180.5 ng cm−2, (f) 360 ng cm−2) and TBZ ((c) 15.1 ng cm−2, (d) 30.2 ng cm−2, (e) 151 ng cm−2, (f) 300 ng cm−2) obtained directly from the surface of the apple pieces. (C) Reproducibility of the SERS signals for in situ TMTD and TBZ detection (the reproducibility and the RSDs were calculated using an original pesticide concentration of 5 × 10⁻⁵ M; each pesticide was tested for five times, and 20 points Raman signal were collected each time. The average value of the 20 data is used to represent the results of each measurement). (D) Comparative Raman spectra of the TBZ (a) and TMTD (b) powder, and (c) the mixture of 5 × 10⁻⁵ M TMTD and TBZ on the apple peel.

Fig. 5