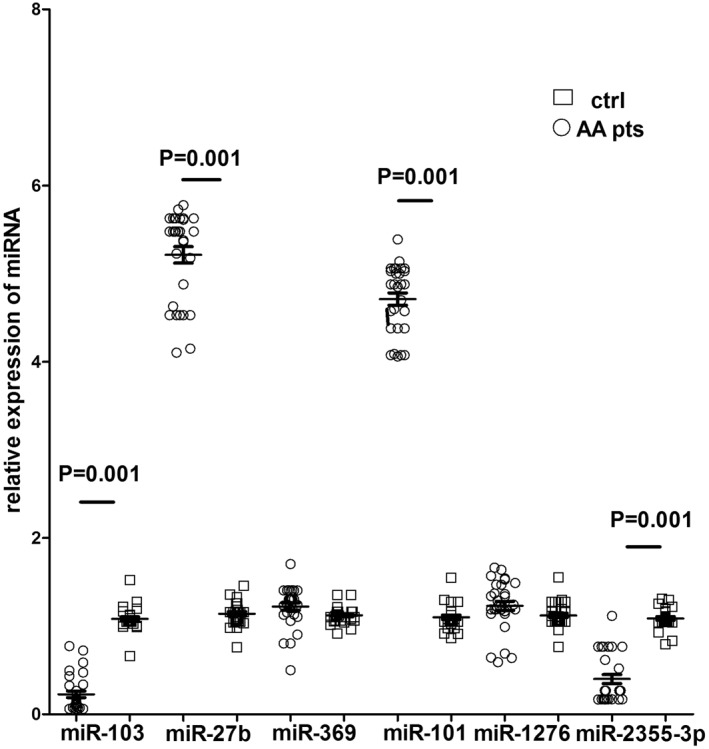
FIGURE 2.

Relative expression of miRNA in PBMCs from healthy subjects and AA patients. Relative expression measurements of miRNA were calculated by real‐time PCR, using the 2‐∆∆ Ct method formula. Fold change (y‐axis) represents the relative expression of the miR‐103, miR‐27b, miR‐369, miR‐101, miR‐1276 and miR‐2355‐3p genes in AA patients (circular plots) in comparison to healthy controls (rectangular plots). U6 small nuclear RNA was used as a control to determine relative miRNA expression. Error bars represent mean and SD of three independent experiments
