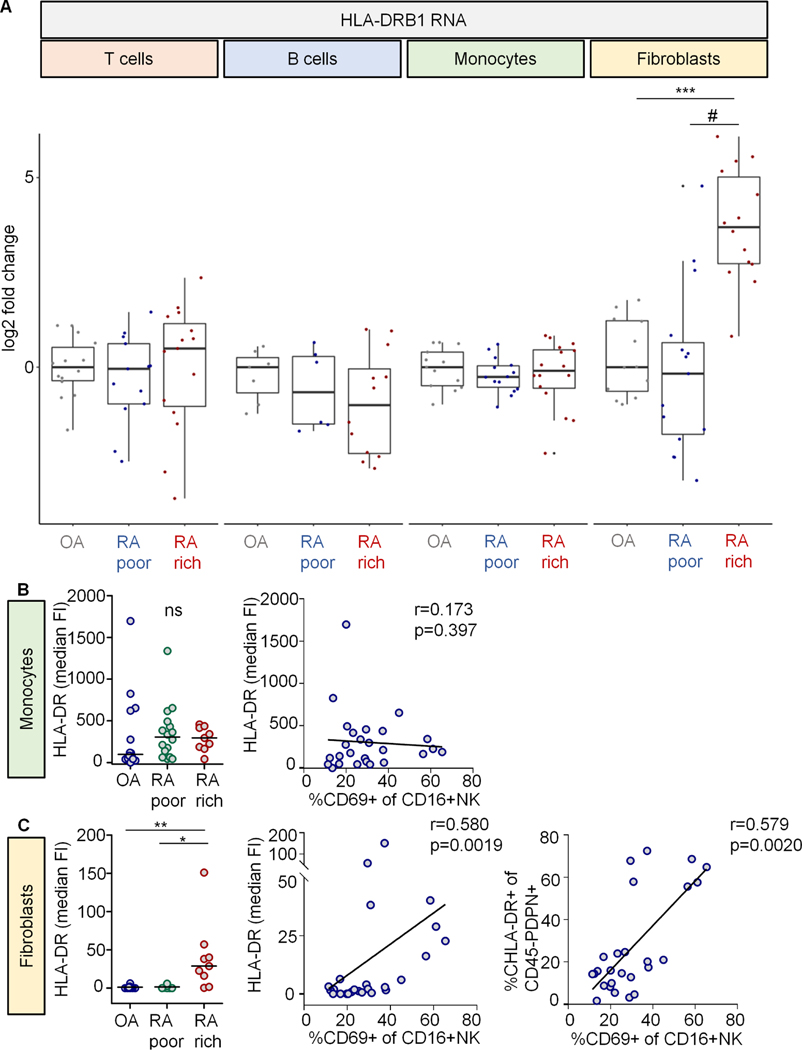
Fig. 3. HLA-DRB1 is upregulated on fibroblasts in leukocyte-rich RA.
(A) HLA-DRB1 RNA expression profiles from sorted populations of T cells, B cells, monocytes and synovial fibroblasts (methods). Log2 fold change in expression of HLA-DRB1 RNA in leukocyte-poor (poor) and leukocyte-rich (rich) RA compared to osteoarthritis (OA). N for each cell type in the order of OA, RA poor and RA rich: T cells = 14; 13; 15. B cells = 7; 6; 12. Monocytes = 13; 14; 16. Fibroblasts = 12; 15; 14. Statistical analysis using Kruskal-Wallis test revealed significance only in the fibroblasts group (p=2.7×10⁻⁵). Post tests: ***, p=2.5×10⁻⁶; #, p=5.3×10⁻⁵. (B, C) Protein expression of HLA-DR in the mass cytometry dataset introduced in fig. 3 (manual gating). Left graphs: Median fluorescence intensities (FI) of HLA-DR on CD45+CD14+ monocytes and CD45-PDPN+ synovial fibroblasts between patient groups (Fig. 3). Kruskal-Wallis test revealed significance in the fibroblasts group. Significant post tests are indicated by stars. ns, not significant. Right XY graphs: Median HLA-DR FI on monocytes and fibroblasts as well as percentage of HLA-DR+ fibroblasts in relation to the percentage of CD69+CD16+ NK cells. r, Spearman’s correlation coefficient. Percentages of HLA-DR+ monocytes are not shown (all cells were positive).

