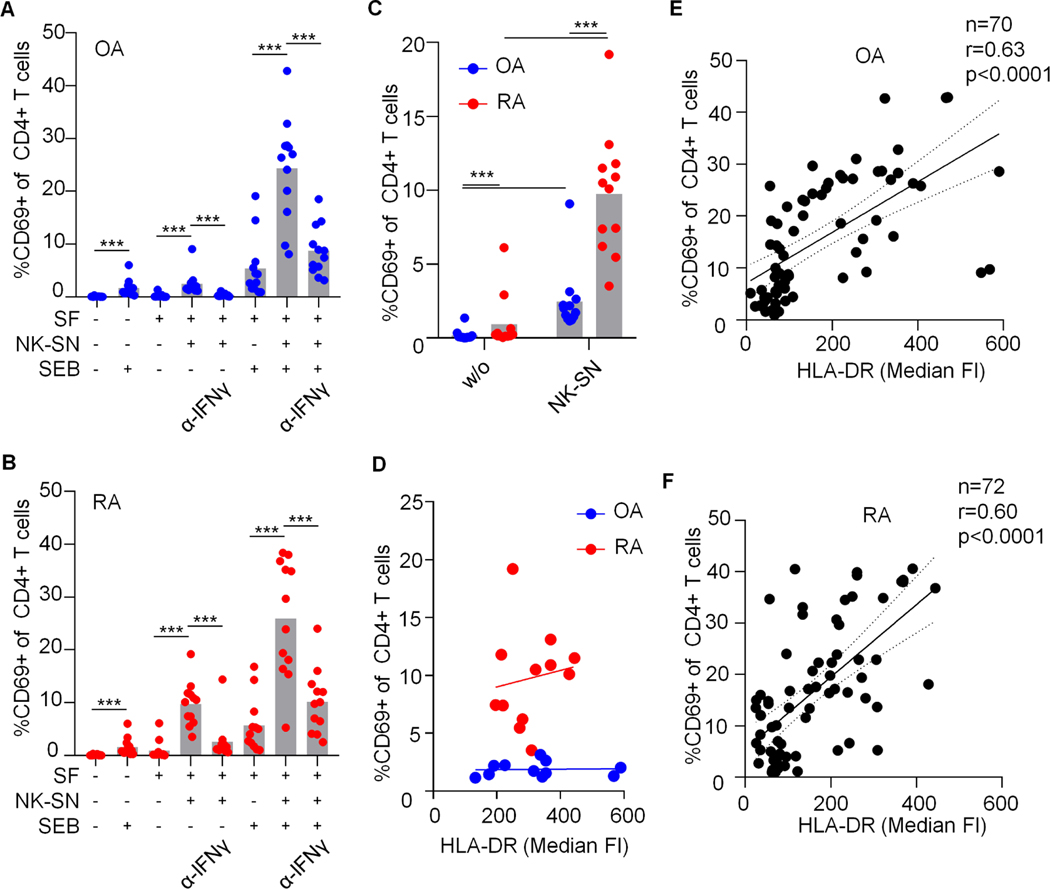
Fig. 6. HLA-DR+CD90+ rheumatoid arthritis fibroblasts induced by NK-SN possess an intrinsically enhanced capacity to stimulate CD4+ T cells.
(A-D) For a summarizing statistical analysis and direct comparison of the effect of OA and RA SFs on CD4+ T cells, we pooled data derived from all series of SEB experiments with identical conditions (n=12). (A, B) percentage of CD69-positive CD4+ T cells after co-culture with OA-SF and RA-SF under variable conditions. (C, D) Direct comparison of the effect of OA-SF and RA-SF on CD4+ T cell activation in absence of SEB. (D) Percentage of CD69+ CD4+ T cells in relation to HLA-DR expression on OA-SF and RA-SF that were pre-treated with pooled NK-SN (OA: n=11, the outlier in C was excluded without relevant alteration of statistical results, r=0.160, p=0.6. RA: n=12, r=0.165, p=0.6). In A, B and C, Wilcoxon test was used to compare selected groups of biological interest. ***, p<0.001. (E, F) Pooled data across all conditions derived from all experiments in which the median fluorescence intensities (FI) of HLA-DR on SFs and the percentage of CD69-positive CD4+ T cells after co-culture overnight were determined in parallel. Correlation analyses were performed using Spearman’s test (r).

