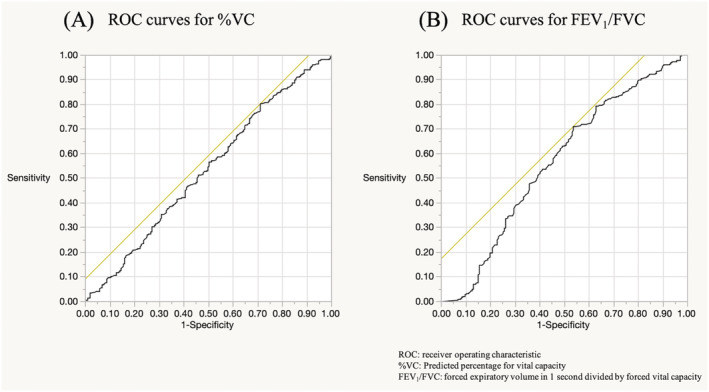
FIGURE 2.

ROC curves for %VC and FEV1/FVC, depending on whether the recovery rate was 50% or more. (a) ROC curves for %VC; AUC 0.53; cut‐off point for %VC was calculated as 64.8%. (b) ROC curves for FEV1/FVC; AUC 0.57; cut‐off point for FEV1/FVC was calculated as 78.9%. %VC, predicted percentage for vital capacity; AUC, area under the curve; FEV1/FVC, forced expiratory volume in 1 s divided by forced vital capacity; ROC, receiver operating characteristic
