. 2019 Jan 25;9(7):3520–3531. doi: 10.1039/c8ra10195g

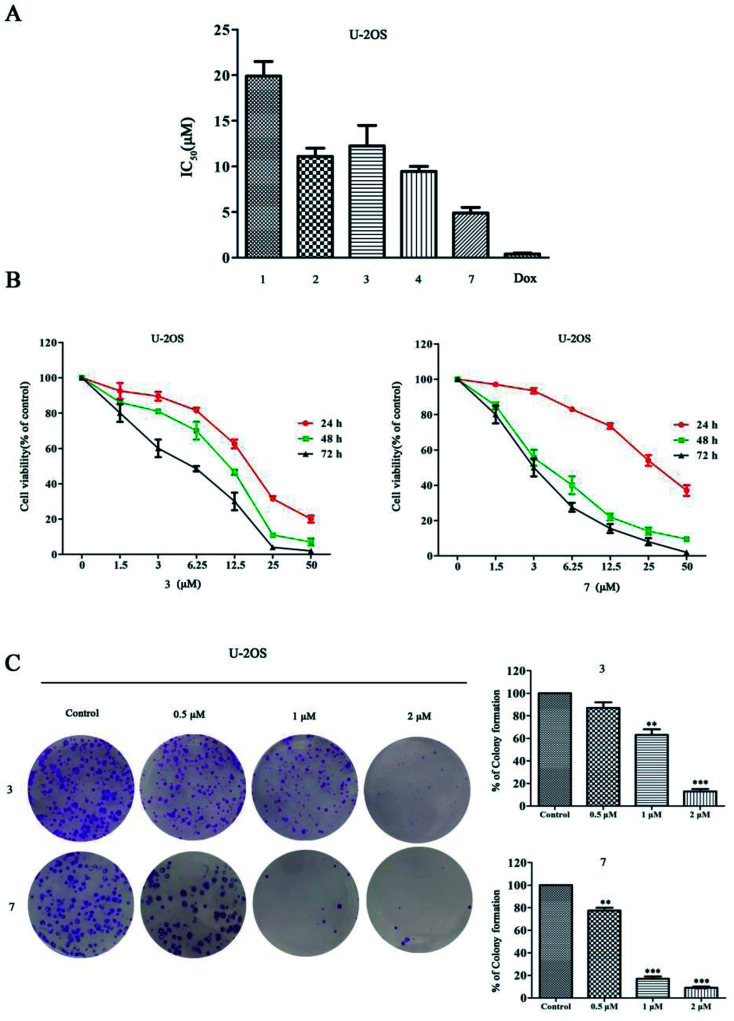
Fig. 8. The effects of stachybochartins A–D (1–4) and G (7) on cell viability in U-2OS cells and on inhibiting U-2OS cell proliferation. (A) U-2OS cells were treated with 1–4, 7 and DOX (positive control) for 48 h, and the IC50 values were quantified using MTT assays. (B) U-2OS cells were treated with different concentrations of 3 and 7 (0, 1.5, 3, 6.25, 12.5, 25 or 50 μM) for the indicated times, and cell viability was determined via MTT assays. (C) The effects of 3 and 7 on the clonogenic ability of U-2OS cells treated for 48 h are shown. The data are presented as mean ± SEM from three independent experiments. *: P < 0.05, **: P < 0.01 and ***: P < 0.001, compared to the control.

Fig. 8