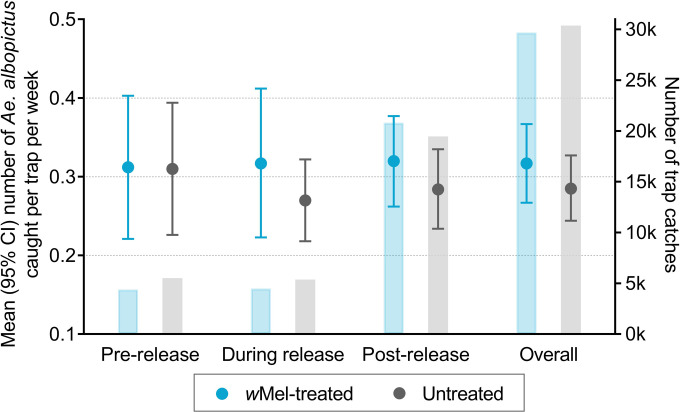
Fig 4. Mean number of Ae. albopictus mosquitoes caught per trap per week by study arm (circles) adjusted for season (wet/dry).
Analysis of the total study period was additionally adjusted for release status (pre-release [March 2015 –February 2017], during release [March 2017 –December 2017], post-release [January 2018 –March 2020]). Bars are the number of trap catches in each arm. The first nine weeks of releases were excluded from analyses due to unequal trapping density in the treated and untreated clusters. There was an average of 4 BG traps/km2 in wMel-treated clusters and 5 BG traps/km2 in untreated clusters in the pre-release period, and 16 BG traps/km2 and 15 BG traps/km2 during and post-release. There was no significant difference in Ae. albopictus abundance before (count ratio 1.00 (95% CI 0.68, 1.49)), during (1.08 (0.78, 1.51)) or after (1.12 (0.87, 1.45)) wMel-deployments.

