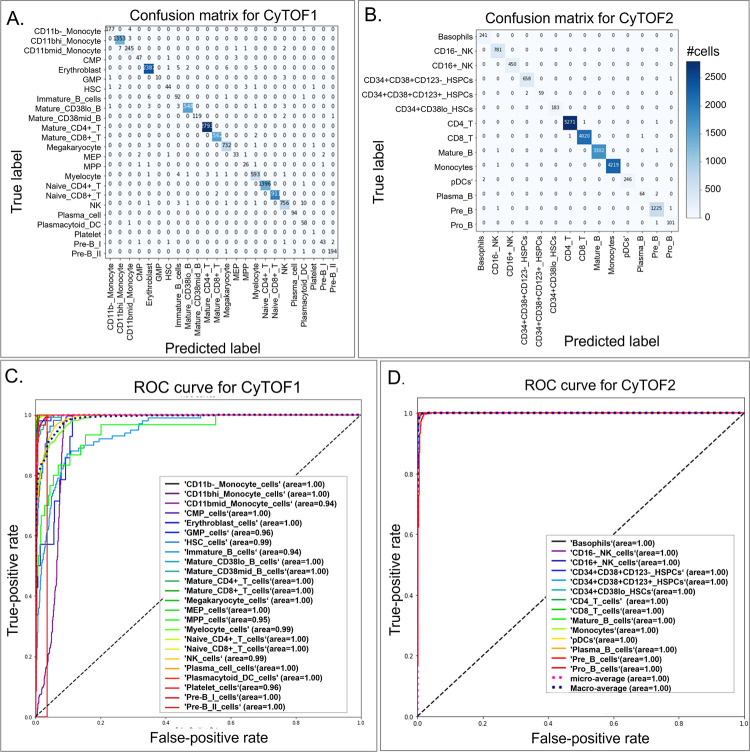
Fig 3. Comparison of confusion matrices and their associated receiver operating characteristic (ROC) curves for real labels of CyTOF1 and CyTOF2 datasets as assessed utilizing the DGCyTOF model.
(A,B) confusion matrices for the (A) CyTOF1 dataset and (B) CyTOF 2 dataset; (C,D) ROC curves for the (C) CyTOF1 dataset and (D) CyTOF 2 dataset.

