Figure:
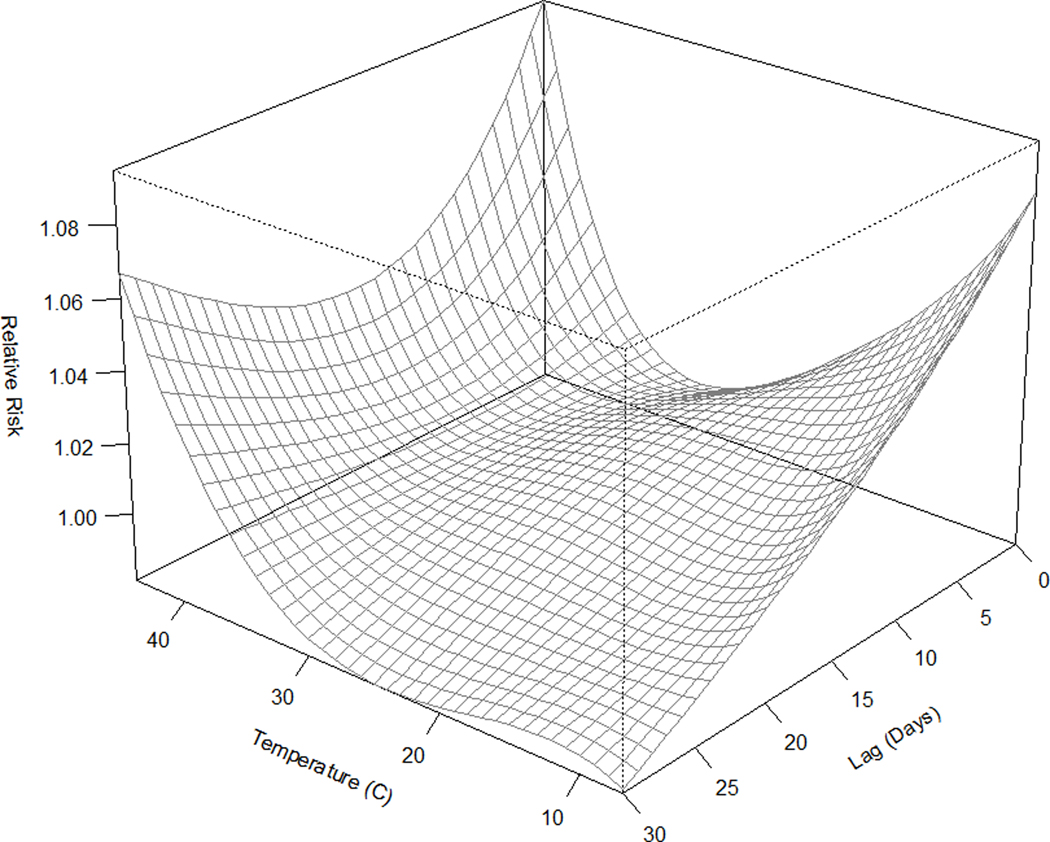
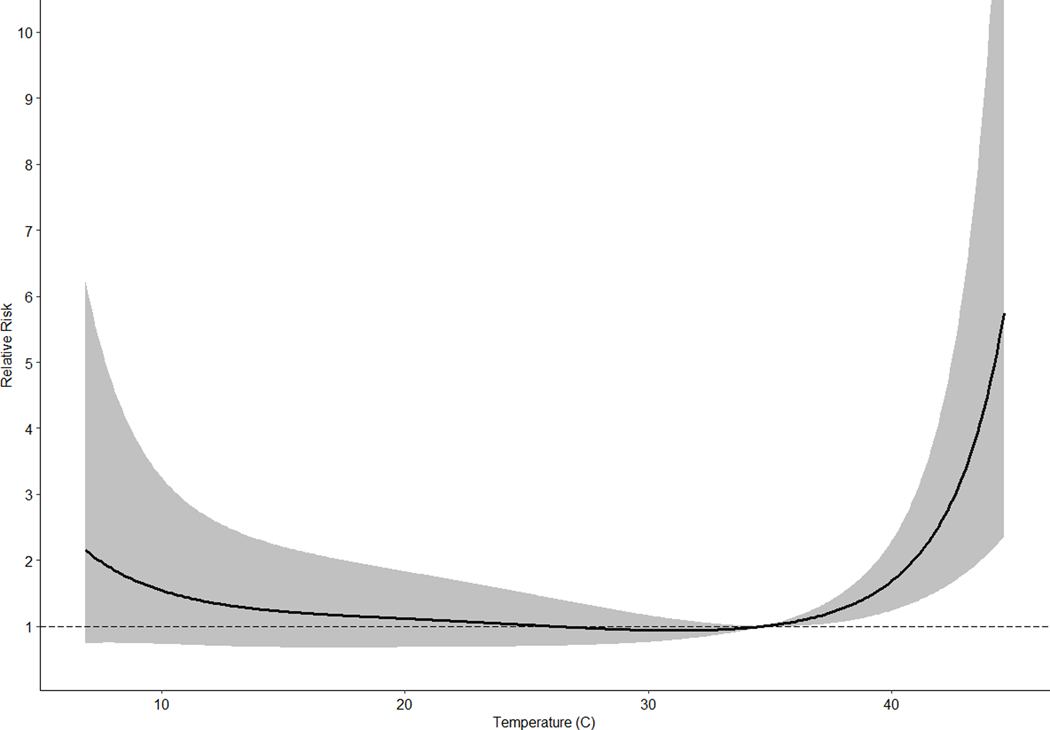
3D plot of adjusted temperature-mortality relationship at specific time lags from distributed lag non-linear models (dlnm). The z-axis shows the relative risk of CVD mortality with respect to the MMT (34.7°C; 94.5°F) and the other axes represent 24-hour average temperature (°C) and lag period (days). The 3D plot only shows the general pattern of the relationship without the confidence intervals around the estimates. (B) 2D plot of adjusted temperature-mortality relationship for a cumulative distributive lag of 30 days with 95% confidence intervals.


