Fig. 3.
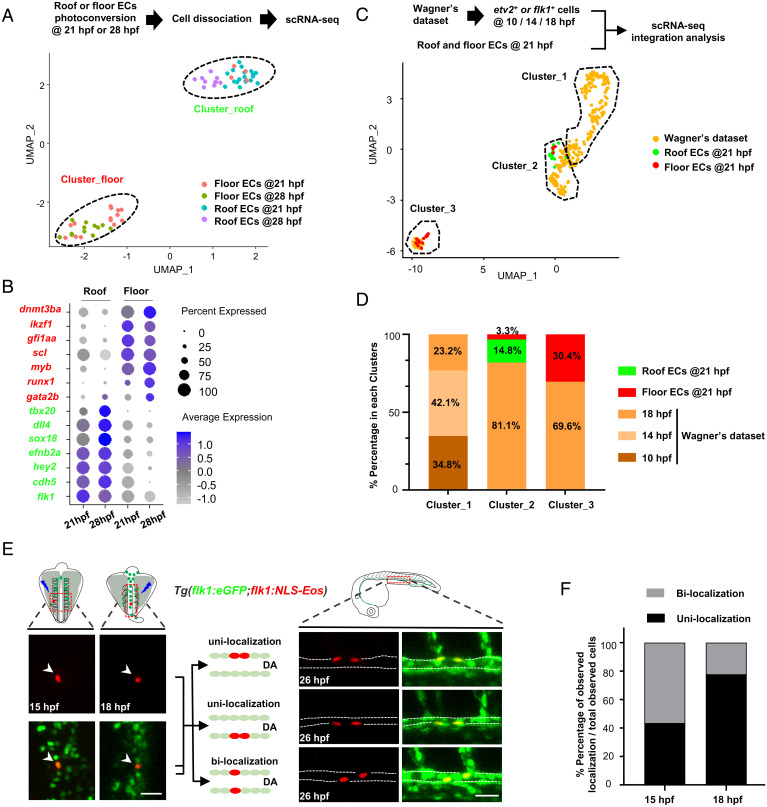
scRNA-seq and fate mapping analyses reveal that HECs and cECs arise from a common precursor and separate prior to the DA formation. (A) Isolation of single ECs from the DA roof or floor after photoconversion (21 hpf, roof/floor ECs, n = 18/18; 28 hpf, roof/floor ECs, n = 10/12) and UMAP plot for cell clustering analysis. (B) Dot plot showing representative marker genes expression enriched in the roof and floor ECs at 21 and 28 hpf. (C) UMAP plot of cell clustering analysis of integrated dataset (Wagner’s dataset at 10, 14, and 18 hpf and dataset at 21 hpf in this study). (D) Distribution percentage (%) of the cells from different time points in each cluster. (E) Single-cell photoconversion and fate mapping analysis in Tg(flk1:eGFP;flk1:NLS-Eos). (Left) Representative images showing single Eos cells photoconverted at 15 and 18 hpf. (Upper Left) Photoconverted areas (see details in Materials and Methods). (Right) Three different localization patterns at 26 hpf (roof and floor only or both in the DA) of the descendants ( 2) derived from a single converted Eos cell. (Upper Right) The observed DA region (see details in Materials and Methods). (F) Bar plot shows the percentage (%) of unilocalization and bilocalization cells in total converted cells at 15 hpf (number of cells: total n = 24; unilocalization n = 11; bilocalization n = 13) and 18 hpf (number of cells: total n = 45; unilocalization n = 35; bilocalization n = 10) stages. Data were acquired by two independent experiments (A) or analyzed by three independent photoconversion experiments (E and F). Cell numbers equal to embryo numbers for single-cell lineage tracing in F. (Scale bars, 30 µm.).

