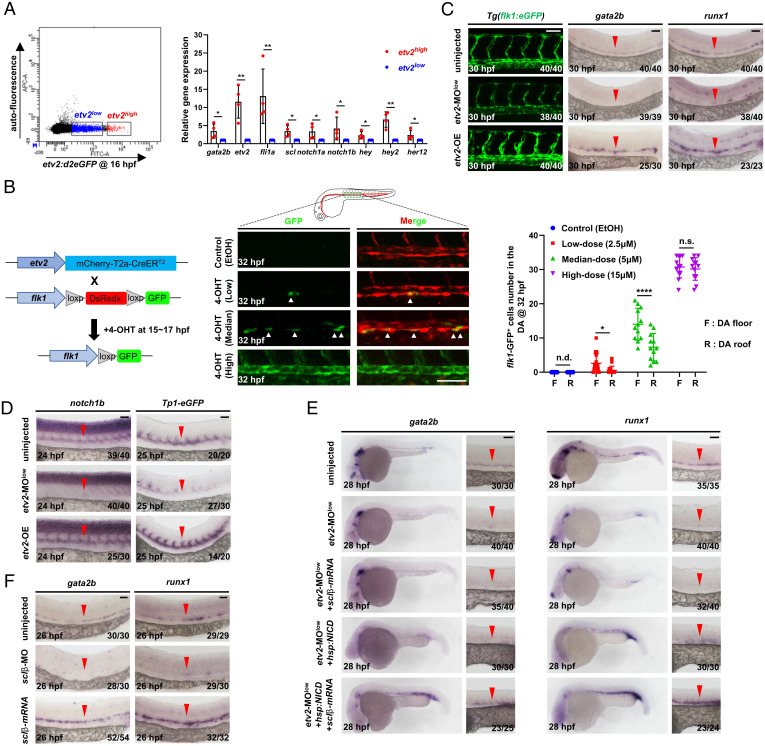
Fig. 4.
Etv2 dosage determines HEC and cEC fate through differentially regulating the activities of Fli1a, Notch, and Sclβ. (A) Flow cytometric and gene expression analysis of Tg(etv2:d2eGFP) embryos. Representative results of flow cytometric analysis at 16 hpf and relative genes expression levels in the etv2-d2eGFPhigh and etv2-d2eGFPlow population. (B) Strategy to perform lineage tracing using double transgenic line Tg(etv2:mCherry-T2a-CreER ;flk1:loxp-DsRedx-loxp-eGFP). Fish were treated with EtOH or different doses of 4-OHT during 15 to 17 hpf, and GFP ECs were quantified at 32 hpf. (C) Lateral views of the DA in Tg(flk1:eGFP) embryos and WISH of gata2b and runx1 in embryos. The embryos were injected with or without a low dose of etv2 MO (etv2-MOlow) to knockdown etv2 or heat-shocked to overexpress etv2 (etv2-OE). (D) WISH of notch1b and eGFP. The embryos were injected with or without a low dose of etv2 MO to knockdown etv2 or heat-shocked to overexpress etv2. (E) WISH of gata2b and runx1 indicates rescue of HECs. The embryos were uninjected or injected with a low dose of etv2 MO, together with or without overexpressing sclβ (mRNA injection) and NICD (heat shock) alone or both. (F) WISH of gata2b and runx1 in sclβ MO knockdown and sclβ overexpression embryos. The embryos were injected with or without sclβ MO or sclβ mRNA. Data are representative of two independent experiments (four biological replicates in A; for embryos, n = 12 in B) or two different clutches of embryos (C–F). n/N reports the number of embryos with staining pattern in image/total embryos (C–F). Heat shock was performed at 14 hpf for 45 min in C–E. Student’s t tests were used in A; two-way ANOVA test was used in B. Data are represented as mean ± SD, *P 0.05, **P 0.01, ****P 0.0001; n.s., not significant (P > 0.05); n.d., not detectable. (Scale bars, 60 µm.).

