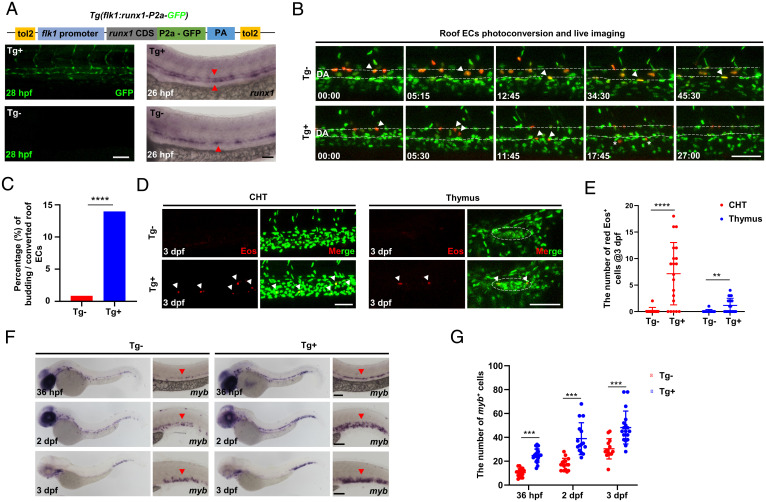
Fig. 5.
Runx1 overexpression promotes HEC fate in the DA roof. (A) Schematic graph showing the construction of Tg(flk1:runx1-P2a-GFP) with representative confocal images of stable F1 fish at 28 hpf and runx1 WISH at 26 hpf. (B) Representative behaviors of the photoconverted DA roof ECs captured by time-lapse imaging during 28 to 72 hpf in Tg (runx1 overexpression) and Tg (siblings without runx1 expression) embryos. The dashed lines denote the roof and floor walls of the DA, the triangles denote converted cells, and the asterisks denote budding cells. (C) Quantification of percentage (%) of the budding roof ECs divided by the photoconverted roof ECs (3/352 in Tg versus 57/408 in Tg). (D) Representative confocal images (after Z-projection) in CHT and thymus at 3 dpf. Fifteen DA roof ECs were photoconverted at 26 hpf in each Tg or Tg embryo, and red Eos cells were quantified at 3 dpf. The dashed circles denote the location of thymus. (E) Quantification of red Eos cells in CHT and thymus at 3 dpf. (F) WISH of myb in Tg and Tg embryos. (G) Quantification of myb cells. Data are representative of three independent experiments with 32 (Tg) and 40 (Tg) embryos in B and C or two different clutches of embryos with (36 hpf, Tg /Tg: n = 18/19; 2dpf, Tg /Tg: n = 15/15; 3dpf, Tg /Tg: n = 15/18) for myb WISH (F and G) or 11 (Tg) and 20 (Tg) embryos for photoconversion and quantification (D and E). Fisher’s exact test was used in C, unpaired Student’s t tests were used in E and G. **P 0.01, ***P 0.001, ****P 0.0001. (Scale bars, 60 µm.).

