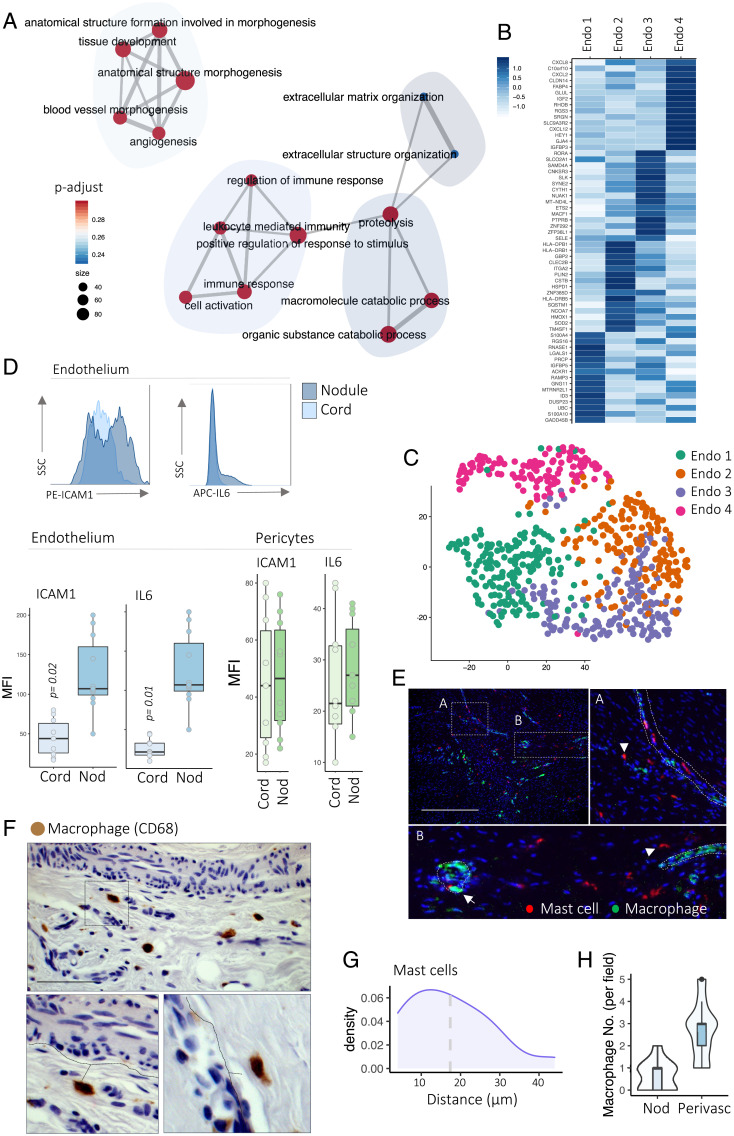
Fig. 3.
Primed endothelial cells are chemokine centers. (A) Network plot showing pathways enriched in endothelial cells in scRNA-seq. Gene ratio is the number of genes found in pathways; p-adjust, adjusted P value (two-sided Wilcoxon rank-sum test, BH FDR correction). (B) Heatmap of scRNA-seq showing z score–normalized mean expression of endothelial subset marker genes (n = 12 DD patients). (C) tSNE projections of scRNA-seq of pericytes colored by cell subsets (n = 12 DD patients). (D) Histograms (Top) and box and whisker plots (Bottom) of flow cytometry analysis showing ICAM1 and IL6 protein expression (mean fluorescence intensity [MFI]) in endothelial cells (CD31+) and pericytes (CD31−CD146+) in DD nodules and cords. Two-sided unpaired t test, mean ± SEM (n = 8 DD patients). (E) Confocal images of immunofluorescence showing mast cells (tryptase) and macrophages (CD68) in DD nodules (n = 6 DD patients). (Scale bar, 40 µm.) Arrowheads indicate individual mast cells in DD nodules. (F) Microscopy images of immunohistochemistry showing macrophages (CD68) in DD nodules (n = 6 DD patients). (Scale bar, 20 µm.) (G) Density plot of immunofluorescence analysis showing distribution of mast cell distance from vessels in DD nodules. Mean is 18.1 μm (n = 8 DD patients). (H) Violin plots of immunohistochemistry analysis showing distribution of macrophage distance from vessels in DD nodules (n = 8 DD patients).

