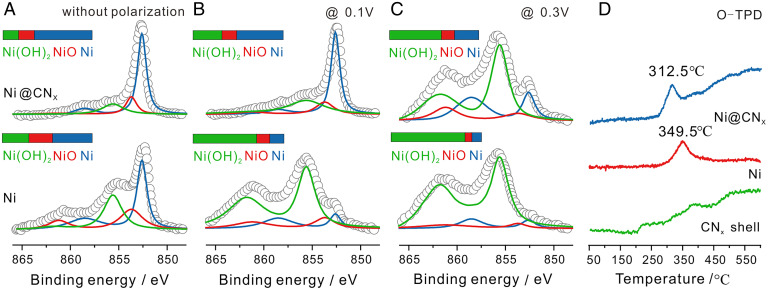
Fig. 3.
XPS and TPD profiles of Ni@CNx compared with Ni NPs. (A–C) XPS spectra of Ni2p3/2 of Ni@CNx and Ni NPs after constant potential polarization for 1 h. (D) TPD of oxygen adsorbed on Ni@CNx, Ni and CNx shell, both of which had been baked in air at 60 °C for 12 h before the test, clearly showing a weakening in the Ni−O bond strength induced by the presence of the CNx shell.

