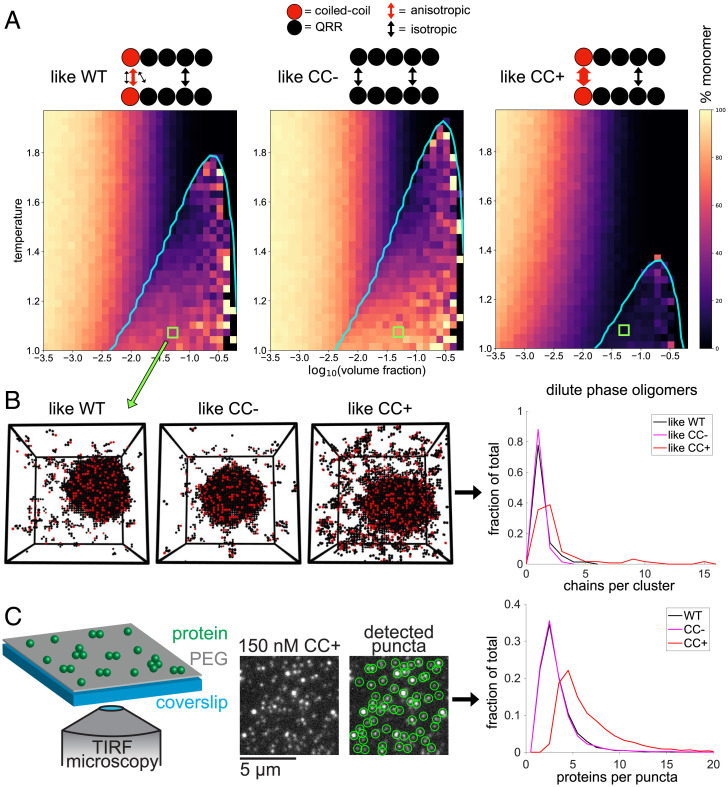
Fig. 3.
Oligomerization weakens phase separation, and vice versa. (A) The CC-QRR fragment is modeled as five beads, with each bead corresponding to ∼20 residues. The thickness of arrows corresponds to the strength of interactions. (B) Plots show binodals (cyan) overlaid on heat maps indicating the percentage of the dilute phase/homogeneous phase that is monomeric. (C) Snapshots of simulations from regions corresponding to green squares in B are shown, and the dilute phase oligomer distributions are quantified for these snapshots. (D) Whi3 dilute phase cluster sizes at low concentrations are quantified via total internal reflection fluorescence microscopy and particle detection.

