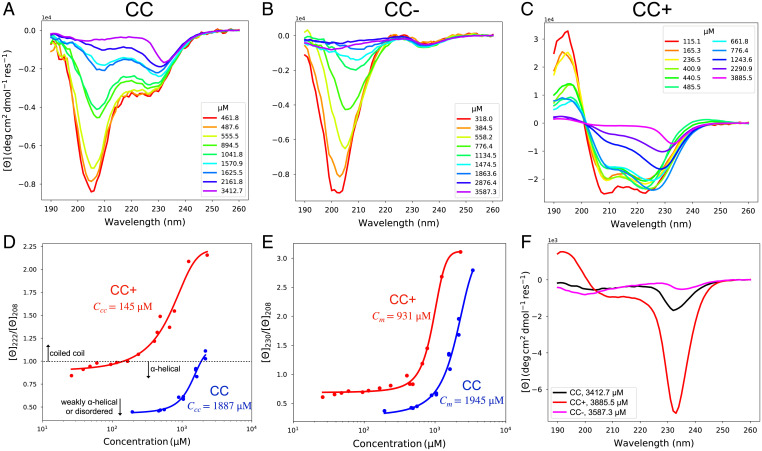
Fig. 4.
Concentration-dependent CD spectra reveal differences in conformational and assembly states across the different CC peptides. (A) CD spectra for the CC peptide. (B) CD spectra for the CC− peptide. (C) CD spectra for the CC+ peptide. (D) The metric for coiled-coil formation is shown as the ratio of the ellipticities at 222 nm and 208 nm from A and C. The dotted line indicates when this ratio is one, above which coiled-coil formation is likely. (E) The metric for higher-order assembly is the ratio of ellipticities at 230 nm and 208 nm from A and C. (F) CD spectra at the highest concentrations measured for each peptide.

