Fig. 5.
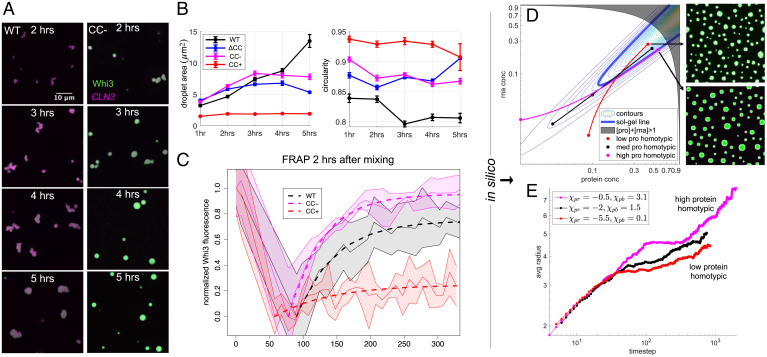
Droplet dynamics are linked to dense phase stoichiometries. (A) Representative images at each time point for WT and Whi3 (CC → CC−) proteins at bulk concentrations of 500 nM Whi3 with 5 nM CLN3. (B) Quantification of average droplet area and circularity for experiments corresponding to A. Error bars are SEM. (C) FRAP curves for Whi3-CLN3 mixtures performed 2 h after mixing. FRAP curves for five to eight droplets for each protein were recorded; dashed lines indicate model fits to the mean, and the shaded areas indicate ± 1 SD. (D) Parabolic sol-gel contours with the sol-gel line in bold blue are overlaid by dilute, bulk, and dense phase equilibrium concentrations of simulated systems with different protein homotypic interaction energies. For fixed bulk concentrations of protein and RNA, alteration of the protein homotypic interaction energies results in dense phase concentrations that lie at varying depths beyond the sol-gel line. Simulation snapshots after steady state has been reached in the low protein homotypic and high protein homotypic interaction energy systems are shown. (E) The average radii of droplets from simulations in D are shown as a function of time. The legend provides values for the interaction parameters in the Flory–Huggins free energy that determine whether the systems encode low, medium, or high protein homotypic interaction energies.

