Fig. 3.
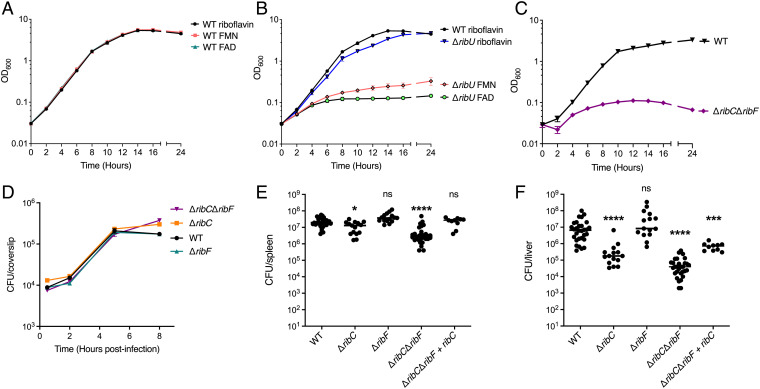
L. monocytogenes scavenges FMN and FAD from the host cytosol using RibU. (A) Broth growth curves of WT L. monocytogenes grown in chemically defined synthetic media with riboflavin, FMN, or FAD as the only flavin source. OD600 was used to determine cell density. The data show the means and SDs of four independent experiments. (B) Broth growth curves of the ΔribU mutant L. monocytogenes strain grown in chemically defined synthetic media with riboflavin, FMN, or FAD as the sole flavin source. WT L. monocytogenes grown in chemically defined media with riboflavin is used as a reference. OD600 was used to determine cell density. The data show the means and SDs of four independent experiments. (C) Broth growth curves of indicated L. monocytogenes strains grown in chemically defined media with riboflavin. OD600 was used to determine cell density. The data show the means and SDs of two independent experiments. (D) Intracellular growth curves of L. monocytogenes strains in murine BMMs. BMMs were infected at an MOI of 0.1, and CFUs were enumerated at the indicated times. The means and SEMs of two independent experiments are shown. (E and F) Bacterial burdens in CD-1 mice infected intravenously with 1 × 10⁵ CFUs of indicated L. monocytogenes strains. At 48 h postinfection, the spleens (E) and livers (F) were harvested, homogenized, and plated to determine the CFUs per organ. The data show the combination of at least two independent experiments: WT and ΔribCΔribF (n = 30 mice), ΔribC and ΔribF (n = 15 mice), and ΔribCΔribF + ribC (n = 10 mice). The black lines represent the median CFUs for each strain. Statistical significance of logarithmically transformed CFU values was determined using one-way ANOVA and Dunnett’s posttest using WT as the control. ****P < 0.0001; ***P < 0.001; *P < 0.01; ns, not significant, P > 0.05.

