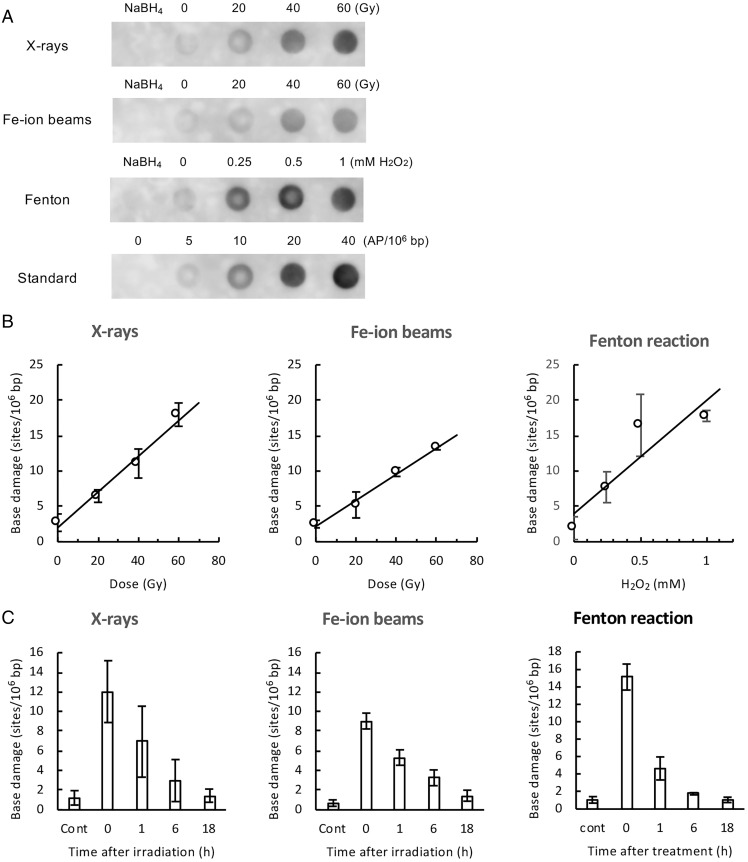
Fig. 2.
Quantification of total base damage by dot-blot ELISA. The total base damage in the treated TK6 cells was quantified by dot-blot ELISA, as described in Materials and Methods (Fig. 1, path B). Purified genomic DNA was treated with Endo III and hOGG1, and the resulting aldehydic groups in DNA were labeled with ARP. ARP-labeled DNA (without RsaI digestion) was dot blotted on a membrane, and ARP labels (i.e., damage sites) in DNA were detected with HRP-biotin antibodies and ECL reagents. The amount of base damage present in DNA was calibrated from the signal intensity of DNA standards containing known amounts of AP sites. (A) Typical dot-blot ELISA images (chemiluminescence signals) of DNA obtained from cells treated with indicated doses of X-rays, Fe ion beams, and Fenton’s reagents. NaBH4 indicates NaBH4-treated DNA, showing nonspecific background signals of the assay. Standard denotes DNA samples containing zero to 40 AP sites per 106 bp, which were used for the calibration of chemiluminescence signals. (B) The amount of total base damage immediately after the indicated treatment as a function of the dose (Gy) of X-rays and Fe ion beams or the concentrations (mM) of hydrogen peroxide in Fenton reactions. (C) Changes in the amount of total base damage during postincubation. Cells were treated with X-rays/Fe ion beams (40 Gy) or Fenton’s reagents (1 mM hydrogen peroxide) and were incubated for up to 18 h. Base damage was quantified by dot-blot ELISA. “Cont” indicates untreated control cells. The data points were the average values of three independent experiments, while error bars indicate the SDs in B and C.

