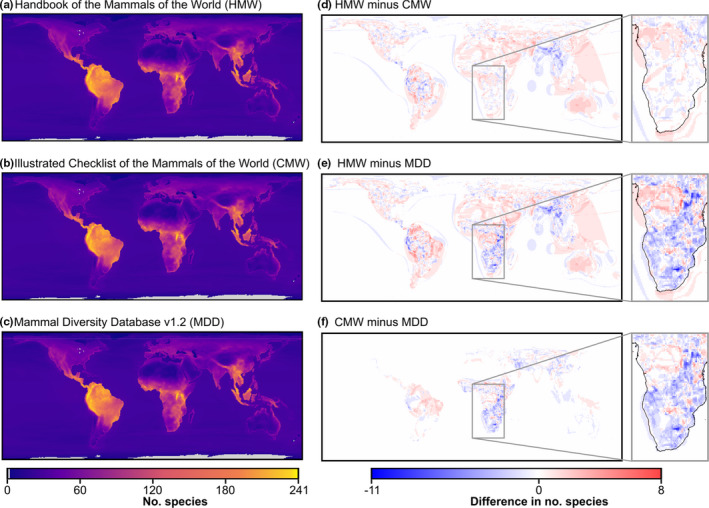
FIGURE 2.

Global richness maps of terrestrial mammals generated by all species with digitisable range maps in (a) the Handbook of the Mammals of the World (HMW), (b) the Illustrated Checklist of the Mammals of the World (CMW) and (c) the CMW harmonised to the latest taxonomy from the Mammal Diversity Database (MDD), as well as the difference in species richness between (d) the HMW minus the CMW, (e) the HMW minus the MDD and (f) the CMW minus the MDD. Detailed regions (sub‐Saharan Africa) for each map of difference are presented to the right, with main differences attributed to the inclusion (HMW, CMW) or exclusion (MDD) of ungulate species from Groves and Grubb (2011). Richness maps were generated by intersecting each species' range map with a global equal‐area grid with cell widths of 0.5° and cell height variable by latitude in the Behrmann cylindrical equal‐area projection
