
Fig. 4.
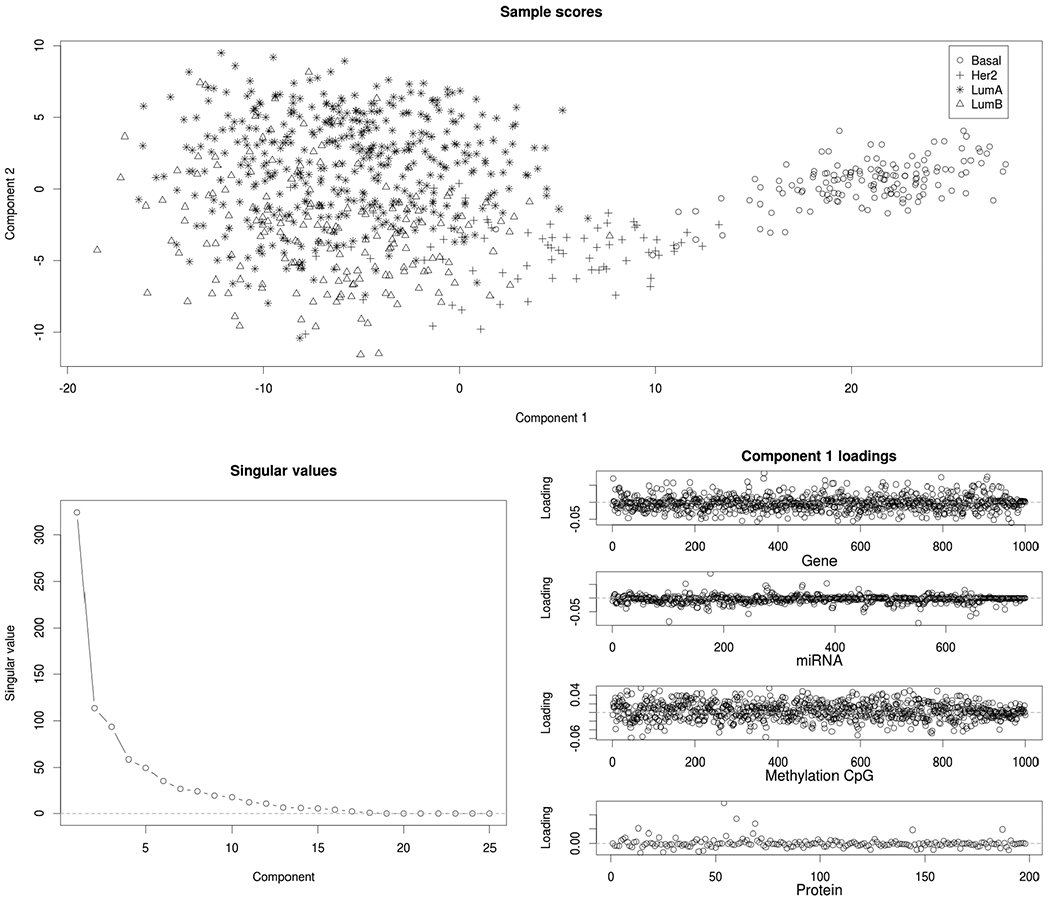
For Module 6: Sample scores for the first two components (top), scree plot of singular values (bottom left), and loadings for all four omics platforms (bottom right). This module includes only breast (BRCA) tumor samples, and it is dominated by molecular signals that distinguish the PAM50 subtypes (Bsasal, Her2, LumA, and LumB).