. 2019 Feb 5;9(8):4435–4444. doi: 10.1039/c8ra10049g

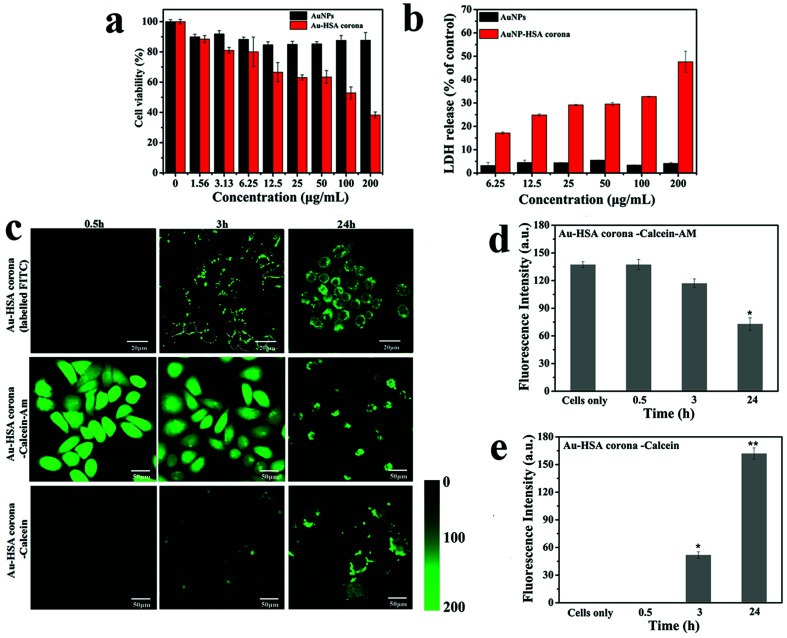
Fig. 5. AuNP–HSA corona internalization in cells. (a) Cell viability of 3A cells incubated with AuNPs and Au–HSA corona for 6 h at different concentrations (200, 100, 50, 25, 12.5, 6.25, 3.13, 1.56 μg mL−1). (b) LDH release from cells exposed to AuNPs and Au–HSA corona or 6 h. (c) Confocal laser scanning microscopy (CLSM) upper line: fluorescent detection of 3A cells by AuNP–HSA corona was stained by FITC (green); middle line: 3A cells were pre-loaded with calcein-AM, and then co-incubated with AuNP–HSA corona for 0.5 h, 3 h and 24 h; bottom line: 3A cells incubated with calcein and AuNP–HSA corona. (d) and (e) Mean fluorescence intensities from confocal images at (c). All data are presented as the mean ± SD of three replicates. *P < 0.05 and **P < 0.01.

Fig. 5