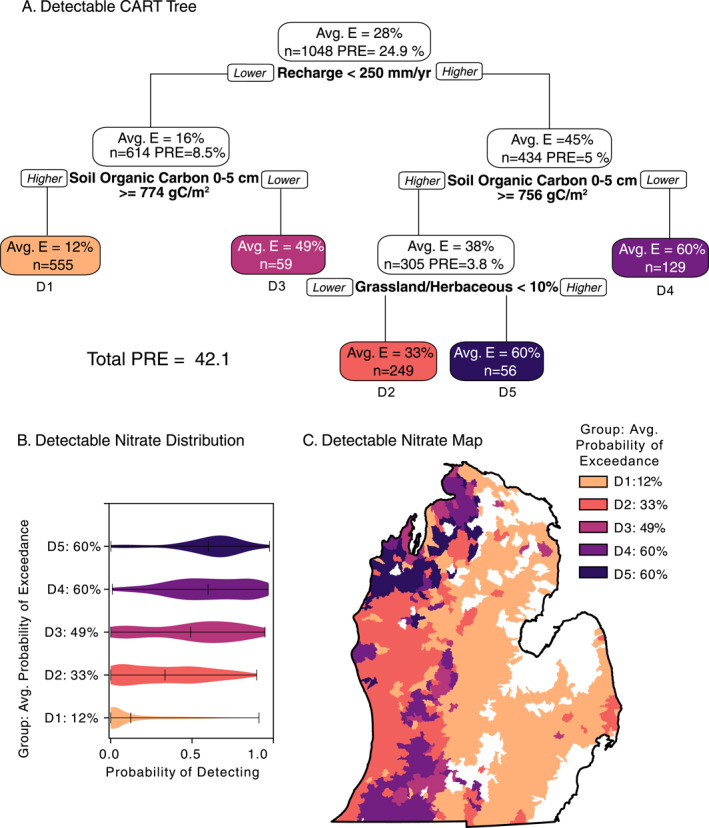
Figure 4.

Detectable (>0.4 mg/L NO3‐N) nitrate classification and regression tree (CART) results. (a) Decision tree produced by CART for detectable nitrate (>0.4 mg/L NO3‐N). Avg. E. refers to the average exceedance probability in the group. Variables and thresholds are shown beneath each node. Final groups are labeled with D1–D5, where D1 is the lowest exceedance probability and D5 is the highest. n shows the number of watersheds in each group. Proportional reduction in error (PRE) refers to the variability explained by each group, where each node PRE sums to the Total PRE. (b) Distributions shown in violin plots for each CART group. (c) Watershed‐level map colored by CART group. Note: Low median probabilities can be of significant consequence at local scales.
