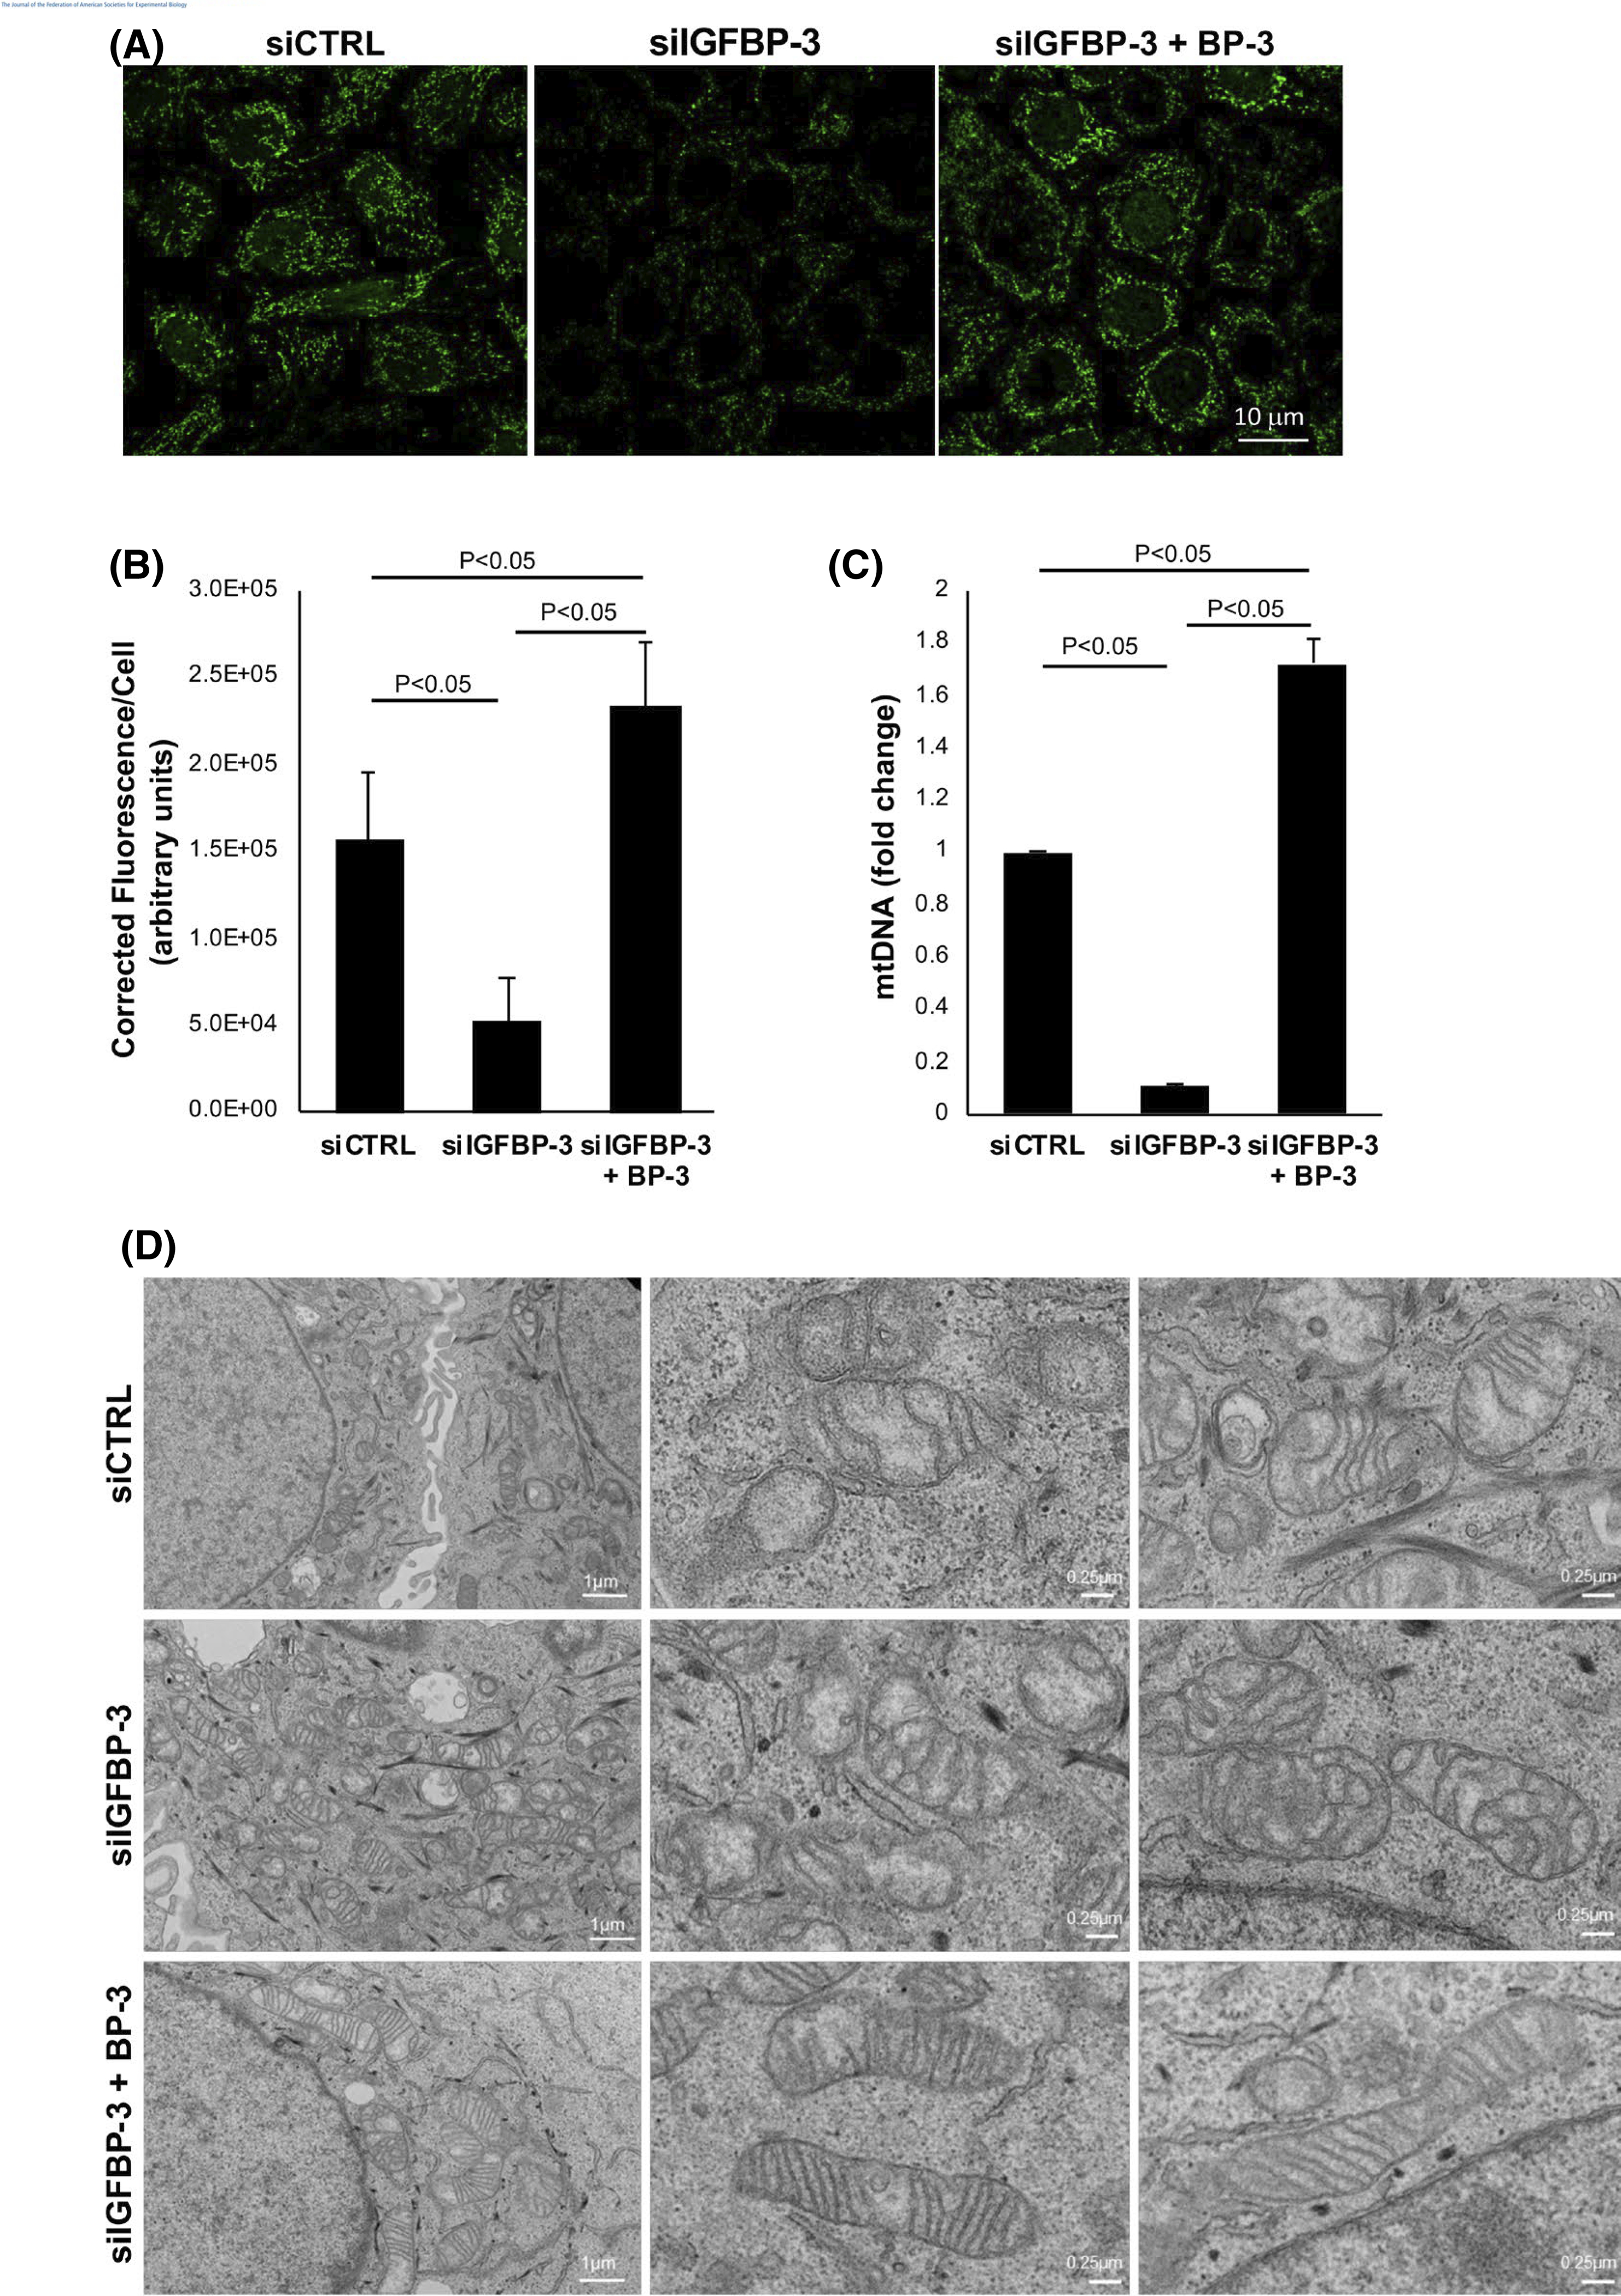
FIGURE 4.

IGFBP-3 regulates mitochondrial morphology and mtDNA levels. hTCEpi cells were transfected with siRNA oligonucleotides targeting IGFBP-3. Non-targeting oligonucleotides were used as a control. Cells were then cultured in KBM with or without 500 ng/ml rhIGFBP-3 for 24 h. (A) mtDNA measured by SYBR green (shown in green) was decreased after IGFBP-3 knockdown. This decrease was blocked by co-treatment with rhIGFBP-3. Scale bar: 10 μm. (B) Quantification of total corrected florescence per cell showed identical changes (p < .05). (C) mtDNA measured by qPCR. IGFBP-3 knockdown decreased mtDNA (p < .05), while co-treatment with rhIGFBP-3 increased mtDNA compared to the knockdown and control conditions (p < .05). (C) TEM showing distinct changes in mitochondrial morphology and lamellar structure across treatment groups. Scale bar: 1 μm (first column), 0.25 μm (second and third columns). All data are expressed as mean ± standard deviation of 3 repeated experiments. One-way ANOVA with Student–Newman–Keuls post hoc multiple comparison test. KBM, keratinocyte basal media
